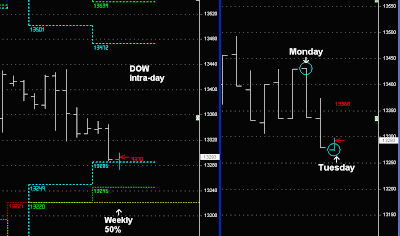
US markets have continued down early on Tuesday as part of the 2-day stall and reversal into the Weekly 50% level...

ES-minis
Early Tuesday and it's trading below the blue channel, whilst it's trading below this level the expectation that Tuesday will push down (random length)
When we look at the DOW the same price action is occuring, but price is trading around a 95 point Spiral low. This often attracts buyers into the market or some early support.
Basically trying to short the market on a lower spiral point and trading around the lower blue channels is open to risk. It makes it harder to be shorting lower opens.
The best trades are trading down from higher spiral points ,as was the case on Monday:- Spiral top and with the view the market is moving down from a higher weekly open.
(Left chart intraday timeframe. Right Chart 95 point ranges)


