SPI Trading Report 10th Dec 2007

~~~~~~~~~~~~~~~~~~~~~~~~~~~~

Please read the Weekly index Reports before proceeding. (Click right)


Above is the Daily SPI chart:- rotating down from October highs into November 50% levels and moving higher from the next monthly 50% level, December.

The expectation is that the market is moving higher in December.

What you notice in the chart is how the trend is clearly defined by the 3-day cycles.

What you also notice is the trend of the Weekly timeframe range being defined by the weekly channels. (green)

Around the extremes of the channels and expectation market will rotate back towards the 3-day cycle, and around the middle of the range price follows the market path once again.

Next week the market path is mapped out to move towards 6735.

Ideally, the best and most profitable trading set-up would once again follow the market down into support and then rise higher as it chases the next level.

The best set-up for this to happen is a 2-day reversal into the trailing 3-day lows and then follow the exact same set-up next week, as last week.

A rise upwards on Monday would be towards 6735, over a couple of days before the most probably reversal back into the 3-day lows.

In Conclusion:- Market is rising higher, expectation market is moving towards the Weekly channels highs, with the best possible trade from lower prices:- ideally around higher timeframe support or 5-day lows.

6647:- Weekly trend guide for next week)
Weekly Index Reports now available (8th December 2007)

Click Weekly Reports and Analysis to the right


All information is owned and copyrighted and cannot be reproduced without consent

DOW E-mini Trading 7th Dec 2007


US markets are now trading above their monthly 50% levels.

And Friday’s trading is going to be confirmed by the Weekly channel highs in both markets.

Above and the Weekly trend continues upwards and a higher close on Friday (Full Weekly report tomorrow)

Friday’s trading is simply going to be defined by the Weekly channel highs:- above and the Weekly trend continues, as it move towards premium contract expiry. (higher close Friday)

Below:- and Friday will probably close around the 5-day 50% level, before the next weekly trend begins next week. (previous report)


Previous report suggested that a Weekly close could be around the 5-day 50% level if there is a push down on Friday:- When we look at those 5-day 50% levels, we can see that they match the Monthly 50% levels.

Therefore any push down on Friday and this is the reference for support on friday, and next week.

A guide on the trend should be Yesterday's 5-day high breakout....

SPI Trading 7th Dec 2007 part 4

15:57

Switched into shorts @ 6684, partial exit @ 6670 (R22 down)

Next Target 6651 (stops 6686)

Looking for R87 down move and gap completion

This entire morning analysis was based on this R87 spiral point high.

Based on sycom close, my expectation was the market would open around the r87 high and move down from this, based on the Daily system, along with gap closure @ 6642

Instead of rising 44 points today, I was looking for a down move of 44 points.

At this point of the day, I’m not sure if it’s going to continue down into the close, but 44 points down will once again match the Weekly breakout of 6647.

But probably remain above 6647 today, and depends on US markets on Friday.

SPI Trading 7th Dec 2007 part 3

Premium Report 11:16am:- SPI gap closure @ 6642, and now trading above the Weekly highs @ 6647.

At this stage it's following the Weekly trend upwards... A rise of 44 points, takes it upwards to the R87 high and the Risk level of 6685. Above Risk and don't short the market again, as the trend is up (random length).

If not following the Daily system but trading longs using the Model and expectation, then the same applies, target 44 points upwards, and hold with breakeven stops....


14:12

Switched into longs at 6651, partial exit 6674 (breakeven stops)

Market following price action of weekly trend breakout and moving towards 6685 (risk)

Forex GBP/USD 7th Dec 2007


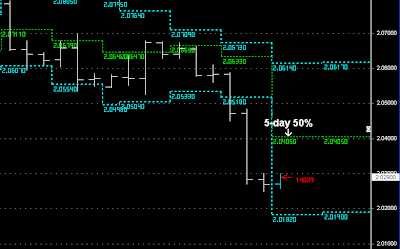
Weekly Trend down and expectation to head towards December lows.

Thursday:- I was looking for an UP move on GBP to short-sell down into channel lows, but price instead continued down into Daily support.

Friday:- same trend guide of using the 5-day 50% level.

Lower Weekly close and expectation of a 2-3 day up move next week towards Weekly 50% level and trailing 3-day highs.

SPI Trading 7th Dec part 2

~~~~~~~~~~~~~~~~~~~~~~~~~~~~~

Premium Report:- Higher open today and the Daily system goes short:- High risk short to be trading a rising weekly trend in both markets, and trading above 6647.

EOD traders:- shorting then the expectation is that the gap of 6642 will close, and hopefully move down 87 points to close yesterday’s Expected ‘gap’ closure. (less probability)

If short trading Daily system today:- use partial exit @ 6643 and move stops to dollar breakeven, with 2nd contract and look for 2nd exit:- 2 ticks above yesterdays lows or around 87 points down.

6643 gap closure will confirm support above the Weekly cycle highs 6647 and could continue upwards and follow much higher prices, especially if US markets move higher.(7th December 8:30am)


10:30


Gap close partial exit @ 6643.

Technically the market looks bullish, (higher Friday close and closure above 6647)

44 points up from today's swing lows will take it to the upper Risk level of 6685 (this morning)

But systems favour holding shorts into lower levels. (stop above today's highs)

SPI Trading 7th December 2007

9:00am

Bullish trend this week and expectation that Price on Friday will close above 6647.

This will confirm and swing the Weekly cycle around, and then the expectation is for a move towards the December highs. (Dilernia Principle 2-month Wave pattern)

Risk 6685:-

Higher Daily open and expectation that price will come down and close yesterday's gap @ 6642.

Gap closure will confirm support above the Weekly cycle highs 6647, and the SPI could move much higher by Monday, especially if US markets continue higher on Friday:- A bullish Weekly trend (higher close on Friday)

A down-day will continue down closing yesterday's gap and move 87 points.

Because yesterday's gap of 6585 didn't close, the expectation that the gap is still open and still a possibility, whether it's today or next week.

DOW E-mini Trading 6th Dec part 2


Thursday:- Early Selling pressure into the 5-day 50% level, support, and then continues with the Weekly Trend upwards, remaining above the December 50% levels.

Friday’s trading is simply going to be defined by the Weekly channel highs:- above and the Weekly trend continues, as it move towards premium contract expiry. (higher close Friday)

Below:- and Friday will probably close around the 5-day 50% level, before the next weekly trend begins next week.

DOW E-mini Trading 6th Dec 2007


This week’s Modeling:-

2-day reversal down into Weekly 50% levels and Support.

Wednesday UP day and Thursday ‘sell’ Day….

The first two have played out, and now we have come to Thursday’s ‘Sell’ Day.

There is a big difference ‘short’ selling UP trending markets compared to down-trending markets.

In UP trending markets the best 'shorts' normally occur in the first part of the trading week as price rotates back down into trailing 3-day lows, ( or gap opens). And the latter part of the week price tries to move UPward ( higher closes on Friday) as it follows the weekly trend.

The Weekly trend is defined by the Weekly 50% level, which has verified support this week, and now we can see the DOW close above the December 50% level.


Today:- Thursday is still a ‘sell’ day, and I would expect some selling pressure before the market tries to rise higher, as what occurred in the SPI today.

Keep in mind a selling day has a random length.

Respect the December 50% levels today…. Above and Thursday is heading towards the 5-day highs.

Below and the 5-day 50% level is the expected rotation zone, which could support the market, but if it’s a selling day and it does move down then the previous 5-day 50% level would be the target.

And As I’ve mentioned before, the closer it comes to expiry the more the market will try and rise because the future contracts are running at a premium.

Forex GBP/USD 6th Dec 2007


Wednesday:- 3rd day sell after 2-day upmove in a '3-day sell cycle'.

Confirmed change of trend when December 50% level broke, with trending down day. (actually earlier with expectation of 90 pip down move below 2.0589)

Expectation for the rest of the week to move lower into a Friday low close, as it heads towards the December lows.

As was the case with US Index markets and the SPI, in downtrending markets the best filter and resistance is the trailling 5-day 50% level.

Thursday:- Expectation to rotate upwards into 5-day 50% level.

If looking to trade the currency then the 5-day 50% level is your best risk filter on Thursday, with a continuation down into the blue channel lows.

SPI Trading Report 6th Dec part 3

~~~~~~~~~~~~~~~~~~~~~~~~~~~~~~~~~~~
Premium Report:-

“Today is my 'sell' day, and the higher open means that it gives a higher probability trade alignment to short-sell. So the expectation that a down move will be 44 points to close the gap....

It has been a 'sell' zone a number of times and I believe it will be again today. It also matches the gap on the R87 @ 6585.

At that point:- a bullish weekly trend will support the market around the R44 lows and Gap closure, and swing back upwards, as part of the Weekly trend.

However a 'sell' day has a random length:- that means it can swamp the market and actually move all the way back towards the 3-day lows.

'short' sell the market, look for gap closure, but hold last contract into close…


10:55

Partial Exit 6598

Leaving last into close:-

A bullish trend will complete the gap closure and swing back upwards, but I’m not interested in buying the market today.

It’s my sell day, which has a random length, and that length can easily move back towards the 3-day lows. (trailing stop 6623)

SPI Trading Report 6th Dec part 2


10:03

Partial Exit @ 6621, which aligns with the breakout and pivot highs. (entry 6633)

Hopefully it continues down and not reverse back up to take out the highs today....

Premium report to follow....

SPI Trading Report 6th Dec 2007


SPI rising upwards from November 50% level and December 50% level and heading towards a Weekly close above 6647.

The closer it gets to contract expiry the higher it wants to go, but first it needs to close above 6647 on Friday to confirm a weekly change of cycle.

EOD positions exit on higher open today and neutral positions. (premium Report)


Today:- Risk 6621 (5-day highs)

Today is my 'sell' day, and the higher open means that it gives a higher probability trade alignment to short-sell.

So the expectation that a down move will be 44 points to close the gap....

ABOVE 5-day highs and the Weekly trend is a breakout and high Risk to be shorting above this level:- Rising weekly Trend.

DOW E-mini Report 5th Dec part 2


Weekly support confirmed after 2-day reversal and Wednesday was a BUY day.

Above the 5-day 50% level and expectation the market would move back towards it's Highs once again.

December 50% level is major resistance, but Wednesday needs to close and then watch how Thursday trades before trying to 'short' sell the market again.

Keep in mind that December contracts are running at a premium to the SPOT, the closer it gets to expiry the more it wants to move higher.

Full report later.

Forex GBP/USD 5th Dec part 2

~~~~~~~~~~~~~~~~~~~~~~~~~~~~~~~~~~~

A 2-day UP swing and sell down on the 3rd day can move down for the rest of the trading week.

Whilst below Tuesday low @ 2.0589 (90 pip) then the expectation is that price is moving down into another 90 low.

There is still support around December 50% levels, but trading longs below this level on Wednesday is open to risk, because the expectation is that the Weekly trend will continue down… (previous report)


Breakdown on the 3rd day after the 2-day swing.

Whilst below December 50% levels expectation that GBP is moving towards the December lows.

November support isn't valid, but there are the Weekly channel lows that could support price today, before any further weakness continues lower on Thursday or Friday.

DOW E-mini Index Report 5th Dec

~~~~~~~~~~~~~~~~~~~~~~~~~~~~~~~

Weekly report:- major resistance with a high probability that whilst price is trading below December 50% levels, the market will make a lower low.

However this needs to be verified by the break of the Weekly 50% level and 3-day cycles, which might take a few days to unwind.

Short-Term:- higher Weekly open and expectation that there will be a 2-day stall reversal with the Weekly 50% levels a guide of the strength of the trend. (Weekly report 1st December)


US markets have moved down for 2-days into Weekly Support:- and the expectation that Wednesday will have a slight UP bias, with the most probable continuation of any down trend on Thursday:- only if it breaks support.


We can see the levels in the market:- the movement of the 5-day lows have now come into the Weekly 50% levels, so there is a cluster of support around these lows.

The trend on Wednesday is going to be defined by the 5-day 50% level: -

Above and expectation that the market is heading back towards the highs

Below and expectation that market is being pushed back down into support early in the day.

Don’t trade longs below 5-day lows (13217 & 1458)

US markets are much more vunerable due to the downgrades on Financial stocks on Tuesday.

SPI Trading 5th Dec part 4

~~~~~~~~~~~~~~~~~~~~~~~~~~~~~~~~~
Dilernia Principles:- (Weekly Report 1st December)

1. Short-term:- higher weekly open has a much greater potential to reverse back down at the start of the new week.

2. Change of 3-day cycles:- probability of a reversal back down into the ‘gap’ re-test (3-day breakout)

Wednesday Support:- BUY Day


15:20

Wednesday opened below monthly timeframe support levels, and after some early support and 22-point upswing the market drifted down into an R87 low (spiral point)

The monthly 50% levels are the driving force in global market trends.


This primary spiral point is going to be verified by US market support overnight.

At this point price is trading below monthly 50% levels, and moving down from a higher weekly open. And as I mentioned nearly two weeks ago “a classic Bear pattern” sell off has now the potential in Australian markets to make a lower-lows in December.

Price has gone from above monthly support defined by 50% levels, to now being below monthly support levels.

UP swing from these lows will move 87 points upwards overnight or tomorrow if markets remain stable in US on Wednesday.

Forex GBP/USD 5th December


Friday last week I was looking for a push down due to the Weekly drops in the market.

The Sell continued down closing below the 3-day lows (change of cycle from BUY to Sell)

This week my expectation that December 50% level would support the currency and move back towards the 3-day high.

This was based on higher timeframe 50% levels along with 90 pip spiral lows.

Yesterday the support came in but then the moved below the Spiral low. After the early push upwards on Tuesday has now put the currency on alert for a break lower:- A 2-day UP swing and sell down on the 3rd day can move down for the rest of the trading week.

Whilst below Tuesday low @ 2.0589 (90 pip) then the expectation is that price is moving down into another 90 low.

There is still Valid support around December 50% levels, but trading longs below this level on Wednesday is open to risk, because the expectation is that the Weekly trend will continue down…

Higher timeframe support:- December 50%

Shorter-timeframe (3-day Sell cycle and below Weekly 50% level)

SPI Trading 5th Dec part 3

11:13

That's the concern about any up move today:- Price is trading below monthly 50% level @ 6533

The Buy support and 22 point up move was a valid set-up today, but the follow through is open to Risk because of market dynamics of the higher timeframes.

SPI Trading 5th Dec part 2


10:32am

The R44 spiral point was the ideal risk level @ 6516 today:- it also matched the Weekly 50% level (6516) and 3-day high (6512)

Yesterday the market moved 22 points against the trend before buying support came in, and today it’s done the exact same thing.

First trade entry 6517 (stopped 6509)

2nd entry 6509 :- partial exit 6525 and looking for a 44 point up move, using R22 range lows as entry.

Breakeven stops from entry @6510

I didn’t use the R22 lows yesterday because yesterday was a stall-reversal day, so I was more interested in trying to short the market from an R44 high, but today is my BUY day:- (random length)

Hopefully this move will continue upwards and not reverse down....


A failure of R22 highs from these swing lows @ 6526 and move back down to lows, will probably follow a down move lower.

I won’t be trading longs again because Risk has increased as it’s trading below a number of important levels….

Middle of the 5-day range can go either direction.

SPI Trading Report 5th Dec 2007


Higher Weekly open and expectation of a 2-day stall.

Tuesday completes the 2-day stall.


A bullish market should move up on the 3rd day, it has everything
going for it:- Higher timeframe support, 3rd day UP move with the expectation that a Bullish Trading week needs to close above 6647 to swing the Weekly cycle around.

Technically it all looks well, however fundamentally all the news out of US on Tuesday was bearish.

As much as it looks technically perfect for the move up:- UP day bias after 2-day stall, it's not always the case. As I said in the Weekly Report:- US markets will drag the SPI down.

Below 6512-16 (3-day high and Weekly 50%) and expectation that price is heading back towards the 3-day lows.

The market is trading and opening below both Monthly 50% levels on Wednesday, and these higher timeframe levels are the driving force of the market.

If there is a push down into the 3-day lows, then the only way there is going to be support at this level would be to see higher price in US markets on Wednesday, as part of an UP day:- support off 5-day range lows

Premium Report to follow..

DOW E-mini Report 4th Dec part 3


US markets have completed the 2-day stall reversal:- First expectation this week of two days with down bias.

Tuesday:- Choppy 2nd day with Weekly 50% level supporting the ES.

Currently markets remain trading between the December monthly 50%, (Resistance) and Weekly 50% (Support)


I would have liked to have seen a bit more weakness in Tuesday’s trading, or at least the DOW move upwards 95 points so that there would have been a ‘spiral top’.

When we look at Market Dynamics, we can see that today there is a large gap to the 5-day lows, and both markets are trading above their 5-day 50% level.

On Wednesday, that 5-day gap narrows and the lows jump upwards, all of a sudden the 5-day 50% level is now above price. (short-term weak pattern)

This gives more of a reason to break support on Wednesday and begin a move down towards the December lows, as part of 2nd monthly sell pattern.

However, my analysis was that Wednesday was an UP day, therefore if Weekly support is going to be valid, then the Weekly 50% level along with the 5-day lows will push price back towards the 5-day 50% level and could easily head back towards the 3-day highs.

A test of the 5-day lows in UP trending markets will push prices back towards their highs.

Full report later…..

US Index report 4th Dec 2007 Part 2

~~~~~~~~~~~~~~~~~~~~~~~~~~~~~~~~~~

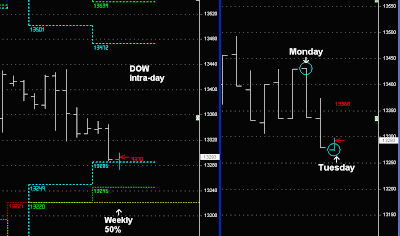
US markets have continued down early on Tuesday as part of the 2-day stall and reversal into the Weekly 50% level...


ES-minis

Early Tuesday and it's trading below the blue channel, whilst it's trading below this level the expectation that Tuesday will push down (random length)


When we look at the DOW the same price action is occuring, but price is trading around a 95 point Spiral low. This often attracts buyers into the market or some early support.

Basically trying to short the market on a lower spiral point and trading around the lower blue channels is open to risk. It makes it harder to be shorting lower opens.

The best trades are trading down from higher spiral points ,as was the case on Monday:- Spiral top and with the view the market is moving down from a higher weekly open.

(Left chart intraday timeframe. Right Chart 95 point ranges)

FOREX REPORT 4th Dec GBP/USD

~~~~~~~~~~~~~~~~~~~~~~~~~~~~~~~~~~~~

"View is for the price to head back towards the 3-day highs @ 2.0793,… so the best trading set-ups for this week would be to trade longs using 90 pip spiral bottoms until the market closes above those 3-day highs...(Yesterday's Report 3rd Dec)"

Tuesday swings down into a 90 pip spiral low and this aligns with the Weekly 50% level, confirming a double support level.

This move sets up a continuation upwards towards the 3-day highs.

I would partial Exit 1-lot around this level, with the expectation that the move will continue the 90-point move Upwards:- ideally a double 90 pip move. (stops below Tuesday's lows)

US Index report 4th December 2007

~~~~~~~~~~~~~~~~~~~~~~~~~~~~~~~~~~~~

"Monday is currently pushing down towards the 3-day lows and Weekly 50% level. I would like 1 more down day on Tuesday and hopefully it has a bit more length than today.

For the market to unwind and move much lower, then there has to be a lower close below the short-term support zones. (Weekly 50% level)

However:- I would look for 1 UP day after any break of support (Wednesday), and then for the continuation of the Weekly down trend the following day:- Sell next day higher open on Thursday (Previous US report 3rd December part 2)


US markets:- major resistance December 50% level, with the expectation of a 2-day stall and reversal back down into Support. (3-day lows and Weekly 50% level)

A ‘weaker’ trading pattern would see a break and move below support, closing the trading day below. Until this happens then there can’t be any following through on the downside.

If you have been watching the SPI today, it has been very choppy trading above higher timeframe support but part of the ‘stalling’ 2-day reversal.

And the same can be said in US markets:- no downside break and markets will remain range bound between two important levels. (monthly resistance and Weekly Support)


Intra-day:-

Support is the blue channel lows in both markets:- below and expectation that this will be another down day with a random length.

Price remains above (support) and another choppy day, but I wouldn't discount price heading back towards the 3-day highs if price bounces of support either, due to December contract expiry coming into play soon.

Once again:- I have a technical view on the markets but I don’t have a high probability trading set-up for Tuesday.

The same with the SPI today, I have a technical view:- higher timeframe support and a ‘stalling’ day. However I didn’t have a high probability trading set-up other than using spiral points as Risk levels.

SPI Report 4th December part 3

11:50am

SPI has been choppy today:- Market support but part of a 2-day stalling-reversal day.


The Market has been supported around the higher timeframe 50% level in early trading, and there was a Push upwards into an area that would have aligned with me taking short positions around the R44 spiral top @ 6564, as part of the stalling day. But it failed by 4 points.

Ideal scenario would be to trade the R44 down and then see if it continues down towards the 3-day lows. (breaks support)

At this stage it continues to look like a stalling-consolidating day.

Next risk level 6516 (spiral low and Weekly 50% level)

SPI Report 4th December part 2


10:08am

Market is following the 2nd day stall-reversal on Tuesday. (choppy-random day)

6538 was an ideal risk level today, because a bullish set-up would have moved upwards from 6538 and headed higher into an R44 spiral top.

The early price action of 22 point moves around these levels (trading above higher timeframe support zones) and today looks like a choppy trading day that needs to settle before trading again.

(long 6538-40 stopped 6533)

Won't trade trade longs whilst it's below 6538, and I won't be trading short positions at this stage either because of higher timeframe support levels.

SPI Report 4th December 2007


Above the 3-day highs, above the Weekly 50% level, above the December 50% level:- Short term and long term levels verify the UP trend.

Weekly expectation:- 2-day stalling period before the trend resumes.

Yesterday was the first day stalling day above the support levels, and today is the 2nd day.

Risk 6538

Tuesday:- another stalling day similar to yesterday and support is 6538 with the expectation that any up move would be 44 points.

Below Risk level and market is moving in a down trend towards the 3-day cycle lows or another 44 points.

If it does move down today it will be hard for me to short the market, or I probably won't short the market because I need a higher spiral point to trade down from to minimise RISK.

Therefore any movement down today, I’ll let the market run it’s course and trade again tomorrow.

No major set-ups for today.

US Index Report 3rd Dec part 2


Higher Weekly open and expectation that there will be a 2-day stall reversal.....


Monday is currently pushing down towards the 3-day lows and Weekly 50% level. I would like 1 more down day on Tuesday and hopefully it has a bit more length than today.

For the market to unwind and move much lower, then there has to be a lower close below the short-term support zones. (Weekly 50% level)

However:- I would look for 1 up day after any break of support, and then for the continuation of the Weekly down trend the following day. (sell next day higher open)

If this is going to follow my overall scenario of price moving back down into December lows, then there would probably be an unwinding of markets over the next 2 days before the 3rd day sends the market down (Thursday).

Market Dynamics is different in this month compared to November, and the longer it consolidates above the Weekly 50% level, and closer it comes to contract expiry the more chance it will move higher:-
March contract is running 100 points at a premium to the current SPOT.

FOREX REPORT 3rd December GBP/USD

~~~~~~~~~~~~~~~~~~~~~~~~~~~~~~~~~~~~

At this stage, the lower Weekly open, along with a major support level (December 50% level) has a much greater chance of finding support and then continuing higher with the over all trend towards December highs. (30th November)


Friday's report highlighted a couple of important variables:- lower weekly open and the December 50% level. (Support)

At this stage my view is for the price to head back towards the 3-day highs @ 2.0793, close above, but then rotate down and consolidate for 2-days, before the next trend can develop in the following week.

This week’s December 50% level support has to be confirmed with the close above the 3-day highs.

This up move began from a 90 pip spiral low, so the best trading set-ups for this week would be to trade longs using 90 pip spiral bottoms until the market closes above those 3-day highs...

US Index Report 3rd December 2007

~~~~~~~~~~~~~~~~~~~~~~~~~~~~~~~~~~
Please Read the Weekly US Index Report before proceeding with the Daily report.


Major resistance with a high probability that whilst price is trading below December 50% levels, the market will make a lower low. However this needs to be verified by the break of the Weekly 50% level and 3-day cycles, which might take a few days to unwind.

Short-Term:- higher Weekly open and expectation that there will be a 2-day stall reversal with the Weekly 50% levels a guide of the strength of the trend. (Weekly Report 1st December)


DOW and ES-minis

US markets are hitting major resistance and expectation that they will come under pressure once again.

Even though I have a modelling pattern of both markets re-testing November lows, the confirming price action needs to close below both the Weekly 50% level and the 3-day lows. This might take a couple of days to unwind.


Intra-day:- There is a cluster of support in both markets.

Weekly 50% level matches the 3-day lows, matches the 5-day 50% level.

IF this support is valid, then the down day needs to confirm the support before the next day moves higher.

Resistance in both markets on Monday 13501 (DOW) and 1494 (ES minis)

No major set-up for Monday.

Below monthly 50% levels the trend is 'bearish'

Above the 3-day cycles and Weekly 50% level the short-term is bullish.

Conflicting price action:- therefore it needs price action to unwind for the next major set-up.

SPI Report 3rd Dec part 5

~~~~~~~~~~~~~~~~~~~~~~~~~~~~~

"R44 spiral bottom then this is the Risk level. A Rise upwards towards 6594 would match the R44 spiral bottom and the 3-month 50% level." (Premium Report 7am)


12:53pm

This morning's Premium Report was based on not knowing the early direction of the market and where today was going to open.

A 44 point low early today would have been a BUY trade with the expectation of price moving up 44 points and into 6594.

Today it opened higher and moved into the R44 spiral point and the 'Sell' zone @ 6580, moved down 44 points, and is now following the early morning analysis of heading upwards.

I wouldn't be looking to 'Sell' the market again today, I would let the market run it's course and see where it opens up tomorrow.

Overall Trend is up....

SPI Report 3rd Dec part 4


11:46

Exit double R22 @ 6545 and exit for today.

Part of a stalling 2-day period above the higher timeframe 50% levels

Random expectation for the rest of today.
No more trades today.

SPI Report 3rd Dec part 3


11:35am

Partial Exit 6566 (re-entry 6578)

Stops 6581)

Expectation of 44 point completion (next exit double R22 range) and exit for today.

SPI Report 3rd Dec part 2


10:40

Partial exit 6575 (6579 entry)

Move stops to above todays highs @ 6583....

If stopped out I will re-enter 'shorts' again using intraday techniques.

Trading Above Dilernia Pivots, so market can remain supported today and not reverse back down until Tuesday.

After 50 minutes of trading below 6580, and it has barely moved 10 points then I've partial covered and moved stops to $dollar breakeven, as price looks like it wants to move towards 6594.

I would have preferred a 22 point down move by now to align with the pivot @ 6558 to partial exit

SPI Report 3rd December 2007

~~~~~~~~~~~~~~~~~~~~~~~~~~~~~~~~~~~

Please Read the Weekly report on the Australian Index before proceeding with the Daily report


Market is trading above the Monthly 50% level, Weekly 50% level and 3-day BUY cycle. In a nutshell the Market is UP, trend remains intact, and we subscribe to the view that the market is heading higher this month.

However, in the short-term:- Higher Weekly open and expectation that the market will stall-reverse-consolidate for the next 2-days before any UP trend resumes.

Today:- Risk 6580

It is the spiral stop of R44 range from Friday, which needs to complete.

I would think that there would be some push down, hopefully around 44 points, but because price is above certain levels there might not be much weakness in the markets today.

There is no major set-up today:- other than trying to pick whether Monday will move down, or Monday is another UP day before the market rotates back down on Tuesday.


Premium Report to follow..