Index & Stock Rpts 10th July 2010 Weekly

Weekly Index & Forex Reports out now...

Australian Index (SPI) Futures

http://austindex.blogspot.com/


DOW and S&P Index Futures


http://usindexweekly.blogspot.com/

US Dollar INDEX, AUD/USD, EUR/USD, GBP/USD

http://www.forexspread.blogspot.com/

OIL Futures:- OIL BOIL

http://www.oilboil.blogspot.com/


Note: Weekly BHP, RIO, and Banking Report Update


  • Daily Trading Set-ups & Analysis
  • Index Futures SPI, DOW S&P, & Forex
  • Subscribe to the Trader Premium
  • http://www.datafeeds.com.au/premiumtrader.html
  • SPI Daily 9th July 2010 recap

    Trend bias is to continue towards Friday's highs.

    Trend guide 4353

    Support Weekly 50% level @ 4332.


    SPI Weekly and Daily range

    Early resistance down into the Weekly 50% level @ 4332.

    Verifies support by 11:20 and then a move back above 4353....

    with a bias to continue towards Friday’s highs.


    S&P (e-mini ) 8th July 2010 Daily recap

    S&P close above the Weekly 50% level @ 1050 and above the Daily highs.

    Any further gains and price is moving towards 1079.

    Random resistance Daily highs.


    S&P Weekly and Daily range


    Thursday has continued towards the highs without retesting the Weekly 50% level @ 1050.

    Based on market dynamics the trend will likely complete the move into 1079 on Friday.


    SPI Daily 8th July 2010 recap

    Resistance @ 4350 (Thursday’s highs)

    Support 4309


    Weekly 50% level @ 4332 (trend guide)


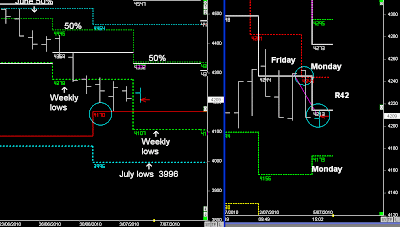
    SPI Weekly and daily range.

    Trend guide today was based on the Weekly 50% level @ 4332…

    Anything below was seen as a reversal pattern towards the 10-day 50% level @ 4309.

    Once support was confirmed @ 4309, the market moved into a consolidating pattern of 21 point ranges below the Weekly 50% level @ 4332 until late trading.

    Above 4332 has seen a move towards Thursday’s highs during sycom, which is precisely a 42-point rise @ 4251 from today’s lows.

    I was expecting the Weekly 50% level to send the SPI back down into
    the July lows, but the S&P's rally and daily close above the Weekly 50% level can see more short-term gains.

    S&P's rally didn't begin from any higher timeframe support levels during
    July, which is a bummer....

    As I was looking for swing patterns back towards the monthly 50% levels in July but only after hitting July's lows first


    S&P (e-mini ) 7th July 2010 Daily recap

    "Blue channel high @ 1023 is the trend guide....

    I now have the view that the market is moving towards a lower Friday close, after yesterday's failure of the previous Weekly low @ 1037.50"


    S&P Weekly and Daily

    S&P rallied on Wednesday and is now trading above the Weekly 50% level.

    I wasn't expecting that to happen so soon without the S&P at least reaching 998.50 (Red) before the first potential swing back towards the Weekly 50% level.

    Unless globex moves down and Thursday opens below the Weekly 50% level, the bias is to follow the daily range upwards.


    • Daily Trading Set-ups & Analysis
  • Index Futures SPI, DOW S&P, & Forex
  • Subscribe to the Trader Premium
  • http://www.datafeeds.com.au/premiumtrader.html
  • SPI Daily 7th July 2010 recap

    My view remains a move back down towards the July lows or a lower Weekly close by Friday.

    Trend guide 4263-66

    With a view for the R42 range to complete down.


    SPI Weekly and daily range.

    Yesterday’s reversal into the Weekly 50% level would normally set-up a move down towards the July lows.

    Yesterday’s trading was a minor short-term counter-trend pattern from 4170 into 4322, which will often see the trend gradually rotate downward until Friday.

    Today’s price action open below and failed at @ 4363 in early trading, moving down 42 points and then a consolidation pattern to close out Wednesday.


    • Daily Trading Set-ups & Analysis

  • Index Futures SPI, DOW S&P, & Forex

  • Subscribe to the Trader Premium

  • http://www.datafeeds.com.au/premiumtrader.html
  • S&P (e-mini ) 6th July 2010 Daily recap

    Breakout from last week @ 1037 extends down towards this week's lows by Friday.

    Random resistance 1026.75


    S&P Weekly and Daily range.

    Tuesday has seen a move upwards and a retest of last week’s breakout @ 1037.50.

    The reversal pattern aligned with a 3-day cycle highs and price has been pushed back down.

    There are two possible patterns that are going to play out this week…

    Continue back towards the Weekly 50% levels….

    Or follow my view of a move downwards by Friday, as part of the break and extend pattern towards the July lows.


    SPI Daily 6th July 2010 recap

    Support 4166-73

    Trend guide 4196.

    Above 4196 look for a move towards 4225 and then 4245.


    SPI Weekly and Daily range.

    Lower daily open and aligned with the Daily lows @ 4166…

    Price needed to clear 4196 for the trend to continue upwards, with a late spike as high as the channel @ 4257 & then the Daily 50% level @ 4270.

    The SPI currently remains supported around 4170 and today’s up move failed to provide a single R21 reversal once above 4197. (Trending day)

    Weekly 50% level @ 4332.


    SPI Daily 5th July 2010 recap

    Today:- resistance @ 4244, with the expectation that the range is moving down.

    Overall trend is to continue down, but there can be random support around the R42 low @ 4208


    SPI Weekly and Daily range


    There is a breakout of the Weekly lows @ 4278, therefore there is an expectation to continue down into this week’s lows, which is part of my overall view as the market heads towards the July lows.

    Today was simply using the same levels on the way down, as we use the levels for short term countertrend moves on the way up within the 5-day range (42 points)

    If the market moved down in early trading towards 4208 then the bias was to move upwards (42 points)

    If the market moved upwards in early trading the bias was to continue down from 4244 and complete the range @ 4208…

    And possibly follow the Monday range lower @ 4172, whilst the SPI remains below 4213


    • Daily Trading Set-ups & Analysis
  • Index Futures SPI, DOW S&P, & Forex
  • Subscribe to the Trader Premium
  • http://www.datafeeds.com.au/premiumtrader.html
  •