Index, forex, stocks, Commodities 23rd July 2011 Weekly

Weekly Index & Forex Reports out now...

Australian Index (SPI) Futures

http://austindex.blogspot.com/


DOW and S&P Index Futures


http://usindexweekly.blogspot.com/

US Dollar INDEX, AUD/USD, EUR/USD

http://www.forexspread.blogspot.com/

OIL Futures:- OIL BOIL

http://www.oilboil.blogspot.com/

Gold & Silver Weekly Reports

http://goldcoppersilver.blogspot.com/

Note: Weekly BHP, RIO, TLS, Banking Report Update

http://aussie-stocks.blogspot.com/


S&P (E-minis) 22nd July 2011 Recap

Weekly level @ 1346 is seen as random resistance:- 8.5 to 14 points.

As part of retesting Thursday's breakout @ 1334 (support
)

S&P Weekly and Daily

The Weekly level @ 1346 formed resistance on the higher daily open, and pushed the trend back down into Yesterday's breakout level @ 1334.

This level formed resistance, as part of retesting the breakout...

 and  the trend would now normally  rise upwards early next week.

Weekly report and levels out later


SPI Daily 22nd July 2011 Recap

Friday's highs in the day session @ 4562/67.

This could support the trend

Target 4605/10


SPI Weekly and Daily range.
The SPI opened above Friday’s highs @ 4562/67

Whilst above this level the expectation that the trend would continue towards the Weekly highs @ 4605/10 failed to materialised…

As the market remained in a tight 21 point range.

Weekly report out tomorrow.


S&P (E-minis) 21st July 2011 recap

Based on the current price action my view is that it will continue to rise up towards the upper weekly levels @ 1346 by Friday

Support 1315/17

Random resistance Thursday's highs


S&P Weekly and Daily range

This week’s price action along with Wednesday’s close above the Weekly and Monthly 50% levels help set-up further gains this week.

Also helped by the levels in the daily range (support 1315/17).

Thursday’s highs failed to keep a lid on the rise, and the move towards 1346 looks like happening quicker than expected.


SPI Daily 21st Juyl 2011 recap

Trend guide 4528 & Resistance 4546


Today's trading is based on whether the market continues to move upwards, as part of Yesterday's brekout


or whether there's a 2-day reversal towards the 'gap' closure @ 4458....

SPI Weekly and Daily range

Today completed the break and extend pattern from Wednesday's highs @ 4500 into today's highs 4546.

There is still the possibility that there will be a gap closure down towards @ 4458.

However, the current price action from the July lows suggests a higher Weekly close by Friday, as the market continues towards 4721.


S&P (e-minis) 20th July 2011 Daily recap

Moves down the daily highs and into the daily 50% level, which aligns with the July 50% level @ 1313-1314 (support)


S&P Weekly and Daily range


S&P has rotated down from the daily highs and is slipping back into the intra-day support levels, which align with the July 50% level @ 1313

The support levels is the trend guide for the rest of the week.....

Normally I would look at the price action and have the view that the next 2-days will rise upwards, and towards and higher weekly close.

However, when I factor in the 3rd Quarterly level @ 1325, that has been acting as resistance, then that's not a forgone conclusion


SPI Daily 20th July 2011 recap

The SPI has hit the July BUY zones in Sycom....these BUY zones need to be validated with 5-day high breakout  @ 4500

Target Weekly 50% level @ 4537+


SPI Monthly and daily cycles

As noted in yesterday's recap (& report)....

the July BUY zones needs to be validated by a 5-day high breakout.

That breakout was @ 4500., which in theory should extend up towards Thursday's highs.

The current price action is also above the Weekly levels @ 4464, and whilst above this level the market is rotating back towards the Weekly 50% level @ 4537 and heading higher

The overall reversal pattern from the July lows is towards 4721 to 4804 based on the July BUY zone and monthly cycle

for that to happen the market needs to be trading above the weekly 50% level @ 4537

otherwise it won't surprise me to see the Market move back down to close today's gap:-  over the next 2-days:- 4464


S&P (E-mini) 19th July 2011 recap

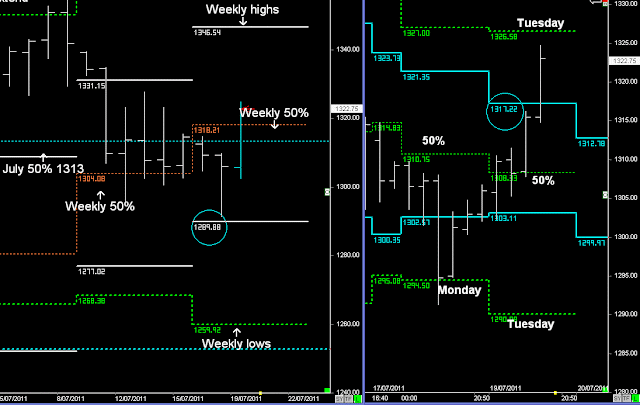
Today is about whether the market remains within the Weekly levels (below the Weekly 50% level)

or Monday's price action continues back towards 1325+

Trend guide the daily 50% level @ 1308.50

S&P Weekly and Daily range.


With the trend being below the timeframe 50%, the bias was to continue down…

However, if the market started to trade above 1308.50 (daily 50% level), Tuesday would have continued back towards the Weekly 50% level @ 1317/1318

That level was a resistance zone of 8.5 points…(daily channel  highs and Weekly 50% level)

But that failed, and Tuesday’s price action is a continuation of Monday’s price action, and a swing back towards the 3rd Quarter level of 1325 once again.


SPI Daily 19th July 2011 recap

Overnight the SPI hit the July BUY zones, and today is about whether the day session will do the same.

Trend guide 4445

SPI Weekly and Daily range

The day session failed to move down into the July lows and support levels, instead it remained once again choppy around the daily filter @ 4445 with little range movement.


These BUY zones in July need to be validated with 5-day high breaks, simply because the same BUY set-ups aren't aligned with US markets, and the negative news regarding the rasing of the debt ceiling could push the market lower.


Trading above the blue channel highs in the 5-day range will be the first sign, and also the Weekly level @ 4464


S&P (e-mini) 18th July 2011 recap

The S&P 500 is below the Weekly, Monthly 50% levels....
and also the daily 50% level @ 1310.75, which suggest more weakness

Random support @ 1302.50

Below support would see the S&P move down into Monday's lows


S&P Weekly and Daily cycles
Weakness on the S&P, as price is pushed down from the Mnothly and Weekly 50% levels, helped by Monday's 50% level, and with the first target around 1302.50 (random support)


With the debt ceiling weighing on the markets, this saw the S&P continue down into Monday’s lows, which provided support, and then 1302.50 provided resistance.


SPI Daily 18th July 2011 recap

My view is that the market will continue down into 4405/4395 and the BUY zones

Resistance 4464 (Weekly level)

Trend guide 4437


SPI Weekly and Daily range


Market didn't reach resistance @ 4464, or move down into 4405

Instead it consolidated in a very tight range around the trend guide level @ 4437