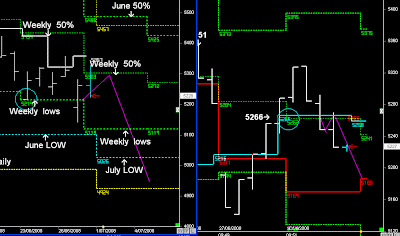
Index Futures & Forex Reports 5th July 08


Weekly Index & Forex Reports out now...


Australian Index (SPI) Futures

http://austindex.blogspot.com/

DOW and S&P Index Futures

http://usindexweekly.blogspot.com/


EUR/USD, AUD/USD. GBP/USD

http://www.forexspread.blogspot.com/


Note: Weekly BHP and Banking Reports Update

http://aussie-stocks.blogspot.com/


  • Daily Trading Set-ups & Analysis
  • Index Futures SPI, DOW S&P, & Forex
  • Subscribe to the Trader Premium
  • http://www.datafeeds.com.au/premiumtrader.html


  • SPI Trading 4th July 2008 recap

    “Note:- Around the 100% of the Weekly lows in the 24 hour market has often provide major support and reversal patterns in the market for the current weekly timeframe.

    That area of interest is around 4953”……
    Thursday’s Report


    Friday’s morning Report:- “Yesterday completed the down move into July's lows, and around these lows I'm expecting a reversal pattern back towards the July 50% levels.

    Yesterday I mentioned that once price reaches 100% of the Weekly timeframe (4953) there is often a reversal pattern in the market.

    Last night the sycom low was 4951.

    A bullish day should continue higher from 5013 and move back towards 5042.

    5042 is a random resistance/support zone.....

    Above and expectation market is moving back towards the 5-day 50% level 5107 :- just be a aware of any break higher from 14:35, which is often the case on Friday's as buying comes in"


    SPI Daily and 5-day pattern

    Today: pretty well played out precisely, from the lows in sycom, and the move from today’s open from 5013 (monthly lows) and back into 5042.

    After most of the day trading below 5042, late buying comes in the last quarter of the day pushing the market back towards the 5-day 50% level @ 5107, but as often as it happens hit a double r44 range and sellers come into the market around the spiral top.

    Weekly SPI Report tomorrow


    • Daily Trading Set-ups & Analysis
  • Index Futures SPI, DOW S&P, & Forex
  • Subscribe to the Trader Premium
  • http://www.datafeeds.com.au/premiumtrader.html


  • DOW S&P 3rd July 2008 Recap

    Morning Report...

    "When we look at the support for Thursday, it's trading around the 5-day lows.

    And we start to begin to see a shift and drop of timeframe levels, and the 5-day high isn't that far away either.

    5-day 50% level is dropping, but the 5-day high is always the first step in a breakout or the beginning of change of direction. (rotation back towards July 50%)

    Of course certain things need to align....like price remaining above the 5-day lows, and follow through.

    Once again trade on the side of support"...


    DOW Daily and 5-day pattern

    Thursday test support and moves back towards the 5-day 50% level.

    The 5-day 50% level on Friday is the trend guide for the rest of this week, along with any potential breakout of the 5-day highs.

    Keep in mind the rotation back towards July's 50% level isn't that far away, as part of a short-term counter-trend move.

    Note: 4th July on Friday is a public holiday in the US, so those levels will be of interest for next week.

          The Stock Report BHP 4th July 2008

          BHP Daily Update....

          http://aussie-stocks.blogspot.com/search?q=BHP


          • Daily Trading Set-ups & Analysis
        • Index Futures SPI, DOW S&P, & Forex
        • Subscribe to the Trader Premium
        • http://www.datafeeds.com.au/premiumtrader.html


        • SPI Trading 3rd july 2008 Recap

          "Today with a 'gap' open the first 21 point range needs to complete to minimise the risk of the first trade, and hopefully it aligns with a spiral indicator or the 5-day lows.

          If 21 points pushes down it should hopefully align with the first support zone of the 5-day lows @ 4985....

          There isn't much more I can say other than use the 5-day levels as shown, and that includes each 5-day range from the previous day..."


          Morning Report

          SPI Daily and 5-day pattern 16:05

          SPI opens around the July lows, completing the double monthly downward move, but any reversal upwards will only be confirmed with prices trading above the Weekly 50% level.

          Today pushed down 21 points on open and found early support, before a late push down into a 44 point low, and once back above the 5-day lows attracting short covering UP into the close.

                • Daily Trading Set-ups & Analysis

              • Index Futures SPI, DOW S&P, & Forex

              • Subscribe to the Trader Premium

              • http://www.datafeeds.com.au/premiumtrader.html

              • S&P (e-mini) DOW 2nd July 2008 Recap

                Morning report....

                "There is a break of the Weekly lows from last week, and often Wednesday does set-up the market for lower prices after a 2-day stall....

                Support as shown, if price does move higher on Wednesday then the previous highs on Tuesday should be use as a trend guide, because prices can reverse back down into support again.

                Below support and it's following the 5-day pattern lower, which is part of the bigger picture of moving down into July's lows."


                S&P daily and 5-day pattern

                Slight push up on Wednesday from support, and then reverses down after a 2-day stall pattern and 3rd sell day, continuing down towards the 5-day lows once again, as it follows the market action of down into July's lows.

                SPI Trading 2nd july 2008 Recap

                "Today:-

                Once again the last 44 point range from yesterday needs to complete, and the spiral filter @ 5145 is the early trend guide.

                5-day lows @ 5110 are going to be important if prices push down early...

                Below 5110 and it continues down"


                Morning report


                SPI 16:15 Recap

                SPI opens and sells off from the spiral filter @ 5144 and continues down into the 5-day lows @ 5110, and then moves into a 2nd double R44 range and low of the day

                The rest of the day moved into a consolidating pattern of 44 point rotations.


                • Daily Trading Set-ups & Analysis

              • Index Futures SPI, DOW S&P, & Forex

              • Subscribe to the Trader Premium

              • http://www.datafeeds.com.au/premiumtrader.html


              • S&P DOW trading 1st June 2008 recap

                Morning report...

                "Same expectation as all global markets:- heading down towards July's lows before any major reversal pattern upwards.

                We can see the S&P trading below June's lows, which has stopped price rotating upwards, and with the resistance shifting on the 1st July, there is still a possibility that US markets could move back towards the Weekly 50% levels before continuing lower.

                Today:- Trade on the side of the Yellow channel. Below Yellow 1282 , and price is moving back down into support 5-day lows."


                S&P Daily and 5-day pattern


                S&P remained range bound most of the trading day between support (5-day lows @ 1265) and the the filter level @ 1282, before making a late move higher back towards the 5-day 50% level into Wednesday.


                SPI Trading 1st July 2008 Recap

                Morning Report....

                "Start of the new Quarter and new Month, and expectation that the SPI is heading lower....Whenever markets drop below the monthly 50% level the ATR increases and so does the volatility.

                Over the next few weeks the volatility is going to remain and the past two days will seem the norm.

                Therefore we need to adjust to the price action, because over the next few weeks in July I think the markets are going to whipsaw between the Monthly 50% levels and July's lows, and have large trending days with numerous 44 point ranges.

                Today:- once again the last R44 range needs to complete from Monday, and then I would like to think that the SPI can reverse back down from the spiral filter...


                SPI Daily and 5-day pattern

                Recap 16:20

                SPI opens and pushes up into the spiral filter and selling off from the 5-day 50% level down into 5185.

                As mentioned in the intra-day report:- once 5185 breaks expectation price is moving down into 5145 to complete the next 44 point range and continue down towards the 5-day lows


                • Daily Trading Set-ups & Analysis
              • Index Futures SPI, DOW S&P, & Forex
              • Subscribe to the Trader Premium
              • http://www.datafeeds.com.au/premiumtrader.html


              • S&P DOW Trading 30th June 2008 Recap

                Morning Report...."Expectation as other markets, moving down towards July's lows, but at the same time price action can move up into the Weekly 50% levels before the trend continues down...

                5-day patterns

                Thursday broke the 5-day lows, but Friday didn't retest the 5-day 50% level to continue down once again, instead Friday just continued down.

                Therefore there is an expectation that price is going to move back towards the 5-day 50% level....

                Simply trade on the side of the Yellow channel by the time the Markets open"


                S&P Daily and 5-day pattern


                Last day of the month and Quarter and US markets have a slight bias UP with a rotation back towards the 5-day 50% level.

                Tuesday's trading is simply going to be defined by the 5-day 50% level and resistance, on whether price continues down towards July's low.....

                Or swings back towards the Weekly 50% level:- 2 day counter-trend move from a lower Weekly open.

                • Daily Trading Set-ups & Analysis
              • Index Futures SPI, DOW S&P, & Forex
              • Subscribe to the Trader Premium
              • http://www.datafeeds.com.au/premiumtrader.html


              • SPI Trading 30th June Recap


                "Last day of the month and Quarter....

                Last 44 point range from Friday needs to complete before Monday's ranges are set-up, and then 5266 will be the trend guide for the rest of Monday...

                As pointed out in the Weekly Report, prices could rise upwards before markets continue downward, but Ideally I would like Monday to move down and early part of the Week move into July's lows looking for the next counter-trend move upwards....

                The important part on Monday is the completion of the last R44 bar and then 5266 as the trend guide for Monday.

                Note:- If the R44 continues higher and completes upwards in early trading, then the same Filter and 5266 will still be the trend guide for the rest of Monday....
                Morning report...

                SPI Daily and 5-day pattern

                As pointed out in the Weekly Report:- prices can reject around the Weekly 50% level and continue downwards, and this is what happened today.

                SPI opened above 5266 moved up into the Weekly 50% level @ 5303 and reversed back down below 5266.

                once below 5266, expectation price was moving back down towards 5185