Index, forex, stocks, Commodities 10th September 2011 Weekly

Weekly Index & Forex Reports out now...

Australian Index (SPI) Futures

http://austindex.blogspot.com/


DOW and S&P Index Futures


http://usindexweekly.blogspot.com/

US Dollar INDEX, AUD/USD, EUR/USD

http://www.forexspread.blogspot.com/

OIL Futures:- OIL BOIL

http://www.oilboil.blogspot.com/

Gold & Silver Weekly Reports

http://goldcoppersilver.blogspot.com/

Note: Weekly BHP, RIO, TLS, Banking Report Update

http://aussie-stocks.blogspot.com/


S&P 500 E-mini futures 9th September 2011 Daily recap

Friday is part of a Weekly HOOK pattern towards the Daily highs using the 50% levels as support.

Those highs are seen as resistance, and look for next week to reverse back down.


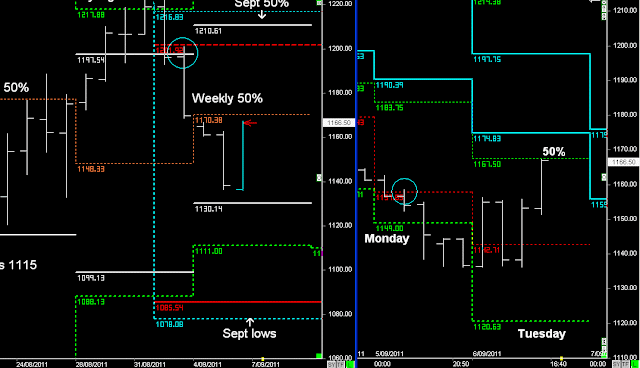
S&P Weekly and Daily range.


My view was that Friday would continue to push upwards, as part of Tuesday’s Weekly HOOK pattern.

However, as we can see that didn’t play out, with the 4-hour close below support, sending the S&P back down into the daily lows.

Even though Friday’s ‘sell-off’ wasn’t factored in at the start of the day, the overall price action is still part of an expected move down towards the September lows.

Still, I would have preferred the market to have hit 1210 (Weekly and Daily highs), as this would have provided an ideal set-up for the next downward leg.

Weekly report out later


SPI Futures Australian Stock Market 9th Sept 2011 recap

Trend guide 4177

my view is that Friday is moving continue higher, as part of a weekly HOOK pattern (higher Friday close)

more buying towards Friday’s highs, but it needs to remain above 4205 after 2.50pm.


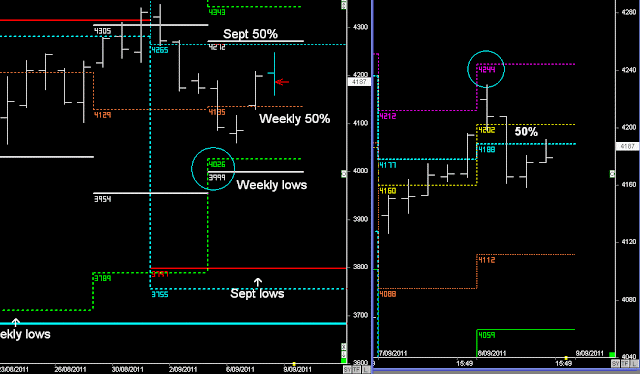
SPI Weekly and Daily range


Early rise from 4177, and it remained above 4205 for most of the day.

My view was that price would continue higher after 2.50pm, reach the daily highs on Friday, but then continue lower next week:- higher Weekly open selling down from Monthly resistance levels


However, instead of moving upwards late in the day….sellers appeared when price dropped below 4205 sending the SPI towards a lower daily close.


S&P 500 E-mini futures 8th September 2011 recap

My view is that Thursday and the rest of this week will remain within the 5-day range:- Thursday's highs are seen as resistance.

Random support levels using the 50% levels...


S&P Weekly and Daily cycles


Price didn’t move up into the daily highs, but drifted back down into the 50% levels, awaiting Obama’s Job’s speech (Thursday evening).

Weekly HOOK pattern still in play....


SPI futures Australian Stock Market 8th Sept 2011 recap

Trend guide and resistance @ 4143/47

If below down side is 42 points into the Support levels (50% level)


SPI Weekly and Daily range


SPI didn't hit resistance @ 4243-47, and support levels didn't hold within the daily range.

Market continued down the Primary range of 84 points from sycom highs and then moved into a consolidation pattern below the 50% levels. for the rest of today.


S&P 500 E-mini Futures 7th September 2011 recap

A HOOK pattern normally occurs on Tuesday, when the market continues down on Tuesday but then reverses and closes back above the Daily 50% level and Weekly 50% level.

Confirmed by a close above 1179.

Once that happens the trend bias moves back towards higher highs by Friday...or on this occasion, back towards 1210 by Friday

S&P Weekly and Daily range.


As mentioned in yesterday’s recap, there was a potential HOOK pattern forming, and more buying during globex hours on Tuesday formed the first stage of a Weekly HOOK pattern


The 2nd stage of the HOOK pattern had to be validated with price trading above the channel highs @ 1179 on Wednesday….

And now price is heading back towards the Weekly level @ 1210, and could go as high as the Weekly highs @ 1229.50 by Friday


SPI Futures Australian Stock Market 7th September 2011 recap

Trend guide 4135 (Weekly 50% level)

Either the market remains below this level and moves down 42 points…

Or it continues upwards.

SPI Weekly and Daily cycles

The market opened above the Weekly 50% level @ 4135 and has continued towards a higher daily close.


The only random resistance zone around 4160 ( providing 21 points), but it then continued upwards and has moved back towards retesting Monday’s Breakout @ 4199.

S&P has continued higher during globex hours, closing above the Weekly and Daily 50% levels, and forming a potential Weekly HOOK pattern.

This is on the anticipation that Obama is coming out with a new jobs package on Thursday


S&P 500 E-mini futures 6th September 2011 recap

Monday's breakout of the 5-day range should continue down into Tuesday's lows...

However, there's random support around the Weekly levels...(1130
)


S&P Weekly and Daily cycles


Tuesday’s pattern didn’t follow weakness into the Weekly level @ 1130.

Instead price has moved back towards the daily 50% level and stalled, without forming a HOOK pattern (as yet).

A HOOK pattern normally occurs on Tuesday, when the market continues down on Tuesday but then reverses and closes back above the Daily 50% level and Weekly 50% level.

Once that happens the trend bias moves back towards higher highs by Friday....

 or on this occasion, back towards 1210 by Friday


SPI Futures Australian Stock Market 6th September 2011

Resistance 4094-4101

Trend bias is to continue from Monday’s breakout down into Tuesday’s lows @ 4043


SPI Weekly and Daily range
Expectation that price would continue lower, as part of Monday's breakout.

This saw the market rise up into resistance levels.... (4101 Monday's day session level)

 and then continue towards a lower Daily close.


S&P 500 e-mini futures 5th September 2011 recap

Trend bias is down whilst it's below the Weekly 50% level @ 1170, as part of the September 50% level rejection pattern

Trend guide @ 1158….

S&P Weekly and daily range…


Once Monday closed below 1158, the trend bias was to follow the overall trend, with an expected break of Monday’s lows.

A breakout of Monday’s lows, should continue to follow the daily range in the short-term towards Tuesday’s lows.

A number of the lower weekly levels can act as random intra-day support levels (8.5 to 14 points)...

but the overall trend is towards the September lows


SPI Futures Australian Stock Market 5th September 2011 recap

Resistance levels @ 4191-97

First target down is 4161 and then towards Monday’s lows @ 4135-37 (matching Weekly 50% level.


SPI Weekly and Daily range.

 
The SPI has continued down on Monday, reaching the Daily lows, which match the Weekly 50% level. (4135-4137)

Often this can result in a swing upwards, helped by a matching support pattern in the S&P 500

However, this isn’t one of those times, as markets are in the process of being rejected down from their September 50% levels....

 and the S&P is being pushed down from its own Weekly 50% level.