Index & Stock Rpts 19th June 2010 Weekly

Weekly Index & Forex Reports out now...

Australian Index (SPI) Futures

http://austindex.blogspot.com/


DOW and S&P Index Futures


http://usindexweekly.blogspot.com/

US Dollar INDEX, AUD/USD, EUR/USD, GBP/USD

http://www.forexspread.blogspot.com/


OIL Futures:- OIL BOIL

  • Daily Trading Set-ups & Analysis
  • Index Futures SPI, DOW S&P, & Forex
  • Subscribe to the Trader Premium
  • http://www.datafeeds.com.au/premiumtrader.html
  • S&P (e-mini ) 18th June 2010 Daily recap

    "Friday is likely to continue towards Friday's highs (resistance)

    Support 1109.25 :- 8.5 points"…


    S&P Weekly and daily range.

    Expectation that 1109.25 would provide some support (minimum 8.5 points).

    Trend didn’t move into Friday’s highs but spluttered after the initial 8.5 rise, closing below the June 50% level and Weekly highs.

    Weekly report out later

    • Daily Trading Set-ups & Analysis
  • Index Futures SPI, DOW S&P, & Forex
  • Subscribe to the Trader Premium
  • http://www.datafeeds.com.au/premiumtrader.html
  • SPI Daily 18th June 2010 recap

    My view is that price will move down 21 points in early trading, but after that I don’t have a view as there are too many levels that can support the market today.

    Resistance 4552

    Support 4519


    SPI Weekly and daily range

    Consolidating trading day to close out the week below the Weekly highs and above the June 50% level.

    Early sell down of 21 points and not much further, and then consolidation with a late move upwards into the close


    • Daily Trading Set-ups & Analysis
  • Index Futures SPI, DOW S&P, & Forex
  • Subscribe to the Trader Premium
  • http://www.datafeeds.com.au/premiumtrader.html
  • S&P (e-mini ) 17th June 2010 Daily recap

    Weekly high resistance.

    Random support 1101.58 and a 8.5 rise back upwards....


    S&P Weekly and daily range.


    Thursday has continued to remain trading between the highs and support.

    My expectation is that these levels will act as resistance for this week only, and my preferred pattern is to see the market move down into the daily lows.

    However, being Friday and Monday the start of a ‘new’ week could see a higher move upwards:- Weekly close above resistance.


    SPI Daily 17th June 2010 recap

    My expectation is that the Weekly highs are forming resistance and there is a possible 3-day reversal pattern back towards next week's 50% level.

    Below 4562 my view is down

    Random support 4519-22
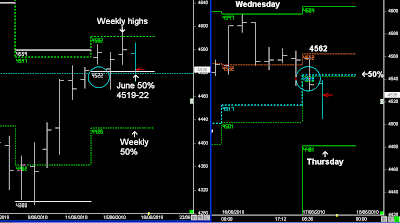


    SPI Weekly and Daily range.

    Spiral filter @ 4555 provided the trend guide for a move down into support.

    Range length was 42 points down and then a move into consolidation/rotation

    Even though 4519 can support the market during the day session, I still have the view that the market is heading towards the daily lows by Friday.

    This based on the Weekly high Resistance pattern seen yesterday.

    However, any moves lower will be dependant on price action in US markets overnight.


    S&P (e-mini ) 16 June 2010 Daily recap

    I'm still treating the Weekly highs and June 50% levels as resistance for this week only.

    Minimum reversal 8.5 points.


    S&P Weekly and Daily range

    Weekly highs form resistance on Wednesday providing a 8.5 spiral range low during the day.

    Currently the market is now trading between two Weekly levels @ 1102 & 1113.

    At this stage I have the view that the S&P is trying to swing back down towards next week's 50% level...

    But for that to happen the market needs to be trading below 1102.


    SPI Daily 16th June 2010 recap

    "Weekly highs in the SPI @ 4590 are seen as resistance along with Wednesday's 5-day highs @ 4597.

    Random support today @ 4552"


    SPI Weekly and Daily range.

    SPI has hit upper resistance levels in the Weekly and daily range, but is now trading above the June 50% levels.

    Today’s higher open had an expectation that price would moved back down into 4552, with matching Monthly 50% level and daily level.

    Weekly highs are seen as resistance this week


    • Daily Trading Set-ups & Analysis

  • Index Futures SPI, DOW S&P, & Forex

  • Subscribe to the Trader Premium

  • http://www.datafeeds.com.au/premiumtrader.html
  • S&P (e-mini ) 15th June 2010 Daily recap

    There is an expectation that price will try and test the weekly highs (June 50% levels) this week

    1090.50 Trend guide…

    Support Weekly 50% level


    S&P Weekly and Daily range.

    This week opened above the Weekly 50% level and there was an expectation that price could move back towards the Weekly highs and June 50% level:- 1111-1113

    Today was either going to retest the Weekly 50% level and channel lows @ 1074, or it was going to continue back towards the daily highs.

    Once Tuesday was trading above 1090.50 the minium move was 8.5 points with the trend continuing into the daily highs and reaching the June 50% level

    Around these upper levels I have the view that the S&P has hit resistance for this week only….


    • Daily Trading Set-ups & Analysis
  • Index Futures SPI, DOW S&P, & Forex
  • Subscribe to the Trader Premium
  • http://www.datafeeds.com.au/premiumtrader.html
  • SPI Daily 15th June 2010 recap

    Trend guide 4519-22.

    Support 4497


    SPI Weekly and daily range

    SPI consolidating around the June 50% level and remaining within the daily range with an early move down into 'random support' @ 4997.


    S&P (e-mini ) 14th June 2010 Daily recap

    "1086 trend guide with Monday's highs resistance....

    Based on current patterns, I would focus on ranges of 8.5 points"


    S&P Weekly and Daily range.

    Monday moved up in the daily highs and reversed back down towards 1086, with a minium move of 8.5 points.