Index Futures, Forex Reports 13th Dec 08

Weekly Index & Forex Reports out now...

Australian Index (SPI) Futures

http://austindex.blogspot.com/


DOW and S&P Index Futures


http://usindexweekly.blogspot.com/

EUR/USD, AUD/USD. GBP/USD

http://www.forexspread.blogspot.com/

Note: Weekly BHP and Banking Reports Update

http://aussie-stocks.blogspot.com/


  • Daily Trading Set-ups & Analysis
  • Index Futures SPI, DOW S&P, & Forex
  • Subscribe to the Trader Premium
  • http://www.datafeeds.com.au/premiumtrader.html


  • DOW S&P 12th December 2008 recap

    "Weekly highs rejection and price is back down into the Weekly 50% level....

    Friday:- at this stage we need to treat the US markets as simply trading within the
    5-day range and rotation up.

    If there isn't any breakout of Friday's lows and price is rising upwards late in the day, then US market could travel as high as the blue channels once again"


    Premium Report


    DOW Weekly and 5-day pattern

    US markets bounce off the Weekly 50% level and move up towards the Blue channel 5-day filter.

    The only sad part of the move was, I would have liked prices to have bounced off Friday's lows....

    Weekly Report out now...


    • Daily Trading Set-ups & Analysis
  • Index Futures SPI, DOW S&P, & Forex
  • Subscribe to the Trader Premium
  • http://www.datafeeds.com.au/premiumtrader.html


  • SPI 12th December 2008 recap

    "Consolidating Weekly pattern, and if we follow the price action over the past 3 weeks of UP and DOWN days, then the expectation is that Friday will close higher than the open.

    But only if it's trading above 3522.

    Lower Daily open can see a push down 22 points before price begins to rotate upwards once again

    5-day 50% level resistance @ 3578 "


    Premium Report


    SPI Monthly and 5-day pattern

    Friday opened lower and moved up from 3522 back into the 5-day 50% level @ 3578.

    This resulted in the Weekly timeframe (5-day pattern) rejection down and closing lower.

    As we can see in the Monthly chart, and as pointed out in last Week's report, the 3-week highs are major resistance zones, and today's trading is simply a lower Weekly close after testing and failing at the 3-week highs on Monday.

    Weekly report out tomorrow.


    • Daily Trading Set-ups & Analysis
  • Index Futures SPI, DOW S&P, & Forex
  • Subscribe to the Trader Premium
  • http://www.datafeeds.com.au/premiumtrader.html


  • S&P (e-mini) 11th December 08 recap

    "3-week high resistance and US markets are slowly drifting lower....

    If US markets are going to continue higher this week, then prices should bounce off support and move back towards the Weekly highs on Friday

    The critical levels in both markets is the blue channel support"


    Premium Report


    S&P Weekly and 5-day pattern

    US markets have drifted down most of the Week after reaching the Weekly highs on Monday.

    As my Thursday report suggests, and move higher on Friday is based on Thursday's support and price continuing higher on Friday:-


    SPI 11th December 2008 recap

    "SPI trying to move towards the Weekly highs @ 3770.

    However looking at the price action of the SPI over the past 2 weeks, there is a pattern of higher daily opens closing lower, and lower daily opens closing higher (consolidation).

    Today is a higher daily open.

    Simply trade the levels:- resistance 3676"


    Premium Report


    SPI Weekly and 5-day pattern

    Higher Daily open around resistance sent the SPI back down into the 5-day 50% level and further...

    The rest of the trading day remained below 3610 and above support @ 3576.


    SPI Daily and CBA Monthly

    SPI has been consolidating for the past 3 weeks, including these past 4 days.

    Higher daily opens followed by lower Daily closes, and lower Daily opens followed by higher daily closes.

    At this stage the SPI isn’t anywhere near 3770, and the only way the SPI
    is going to get that high this week is to see a rally on US markets
    on Thursday (not break support)

    US markets have hit their 3-week highs and have slowly drifted back
    down.

    And depending on where the SPI opens it could be a lower Daily open
    with the bias to rise upwards into Friday (as long as it's above the Weekly 50%)

    Our market has been dragged down by Financials, and the only way the
    SPI is going to rotate UP towards 4051 in December is to see Financials
    find support around their December lows this week, and begin to
    rise upwards from next week.


    • Daily Trading Set-ups & Analysis
  • Index Futures SPI, DOW S&P, & Forex
  • Subscribe to the Trader Premium
  • http://www.datafeeds.com.au/premiumtrader.html


  • DOW S&P 10th December 2008 recap


    DOW Weekly and 5-day pattern

    Another consolidating trading day


    SPI 10th December 2008 recap

    "There can still be 4 days of consolidating price action with a late breakout on Friday and a continuation UP towards the December 50% level next week

    Wednesday:- 5-day 50% level @ 3581 is the trend guide"

    Premium Report


    SPI Weekly and 5-day pattern

    More rotation after the bounce above 3581 in early trading.

    At this stage the trading days are consolidating (with an UP bias).

    ie. higher daily opens and lower closes.

    lower opens and higher daily closes.


    • Daily Trading Set-ups & Analysis
  • Index Futures SPI, DOW S&P, & Forex
  • Subscribe to the Trader Premium
  • http://www.datafeeds.com.au/premiumtrader.html


  • DOW (S&P) 9th DEC 2008 Daily recap

    "Probability pattern were for US markets to move into the 3-Week highs.

    Once those Weekly highs were hit on Monday sellers have driven price back down.

    At this stage they are valid resistance zones (until Broken).

    As pointed out in the Weekly report, i'm factoring that any breakout of these highs will occur closer to Friday"


    Premium Report


    DOW and S&P Weekly

    Weekly highs resistance have played out.

    At tihs stage the bias is to continue down towards the Weekly 50% level.

    If there is a breakout on the upside, as per last Week's report, that more likely to occur closer to Friday.


    SPI 9th December 2008 recap

    "As per Weekly Report, expectation that global markets will be moving
    towards their 3-week highs this week.

    These 3-week highs are often major resistance zones in any trend, and
    there is a possibility that prices can stall and continue with the trend. (DOWN)

    Today is simply trading on the side of the 5-day highs @ 3734

    Below and it's closing the gap of Monday and probably moving down 87 points"


    Premium Report


    SPI Monthly and Weekly (24 hours)

    As we can see, the SPI hit the 3-week highs overnight and the market was driven down by sellers hitting the Financials.

    Sellers also hit the Weekly highs in the US markets late on Monday.

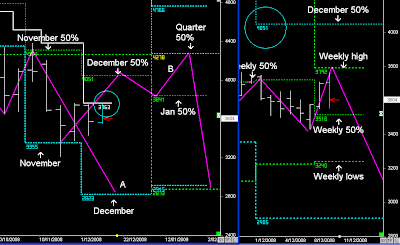
    These 3-week highs are robust resistance zones and price can easily continue down towards December's lows, as it follows the double Monthly low pattern:- SET UP A.

    SET UP B:- is what I think will happen

    The SPI to consolidate below the 3-week highs until it gets closer to Friday, and if Price is trading around the Weekly highs (not below the Weekly 50% ) there is a possibility of a breakout (Friday close) and then beginning of the move towards December 50% level @ 4051.

    Expectation that December 50% level will stall the market, but then continue higher in January.

    This higher move in January will rotate back to the new 1st Quarter 50% level in 2009.

    This also matches the breakout of the 2008 lows :- retest the break.

    Two important patterns in SET-UP B are :- the retest of the Primary breakout in 2008 (Yearly), but also the alignment of the 'Thrust pattern' in the secondary timeframe (Quarterly) , resulting in a new down trend in 2009.


    • Daily Trading Set-ups & Analysis

  • Index Futures SPI, DOW S&P, & Forex

  • Subscribe to the Trader Premium

  • http://www.datafeeds.com.au/premiumtrader.html


  • S&P (e-mini) 8th December 08 recap

    "Expectation that US markets are heading higher towards the 3-week highs in both markets.

    At this stage those Weekly highs are seen as resistance, and if they do breakout it's more than likely to occur on Friday"


    Premium Report


    S&P Weekly and 5-day pattern

    As per Weekly report, the expectation that global markets were moving back towards their Weekly highs this week has played out in the first trading day.

    Normally these highs are viewed as resistance, but because price didn't move in a 2-day pattern instead breaking out of the 5-day range....

    Then my expectation is that US markets should continue higher and follow my view of price moving towards the December 50% levels.


    SPI 8th December 2008 Daily recap

    "After reading my Weekly report I have a bias that the SPI is moving higher towards the Weekly highs this week.

    However on Monday that's going to be difficult if the SPI is opening below the 5-day 50% level and a higher R87 spiral point.....

    Above the 5-day 50% level (3593) and the expectation is that the SPI is rising up 87 points...."


    Premium Report

    SPI Weekly and 5-day pattern 16:10

    Expectation of higher prices this week with the shift in the Weekly 50% level to below price.

    And Monday's trading was the first stage with price rising above the 5-day 50% level pushing 87 points from today's lows.

    For this week to continue higher I would like the SPI to move back down into the 5-day 50% level tomorrow and test support before it continues higher...

    Unless US markets do that for us on Monday.

    • Daily Trading Set-ups & Analysis

  • Index Futures SPI, DOW S&P, & Forex

  • Subscribe to the Trader Premium

  • http://www.datafeeds.com.au/premiumtrader.html


  •