Index, Forex & Stocks 21st Aug 2010 Weekly

Weekly Index & Forex Reports out now...

Australian Index (SPI) Futures

http://austindex.blogspot.com/


DOW and S&P Index Futures


http://usindexweekly.blogspot.com/

US Dollar INDEX, AUD/USD, EUR/USD, GBP/USD

http://www.forexspread.blogspot.com/

OIL Futures:- OIL BOIL

http://www.oilboil.blogspot.com/


Note: Weekly BHP, RIO, and Banking Report Update


S&P (e-mini ) 20th August 2010 recap

"Yesterday saw the market move down into Thursday’s lows and likely to move down into the daily and Weekly lows on Friday

Early resistance 1076-78

Random support 1063"


S&P Weekly and Daily range

Bearish pattern continued down this week from the failure to break 1098.50 and to the breakout of 1084.75 on Thursday and price followed the market model to the letter.

Friday provided a nice little earner on the downside using resistance levels…

And the Weekly lows provided an 8.5 reversal off support.

Weekly report out later


SPI Daily 20th August 2010 Daily recap

Spiral filter Resistance @ 4420-24

Expectation price is moving down into support levels :- 4373-87 (42 points)


SPI Weekly and Daily range.

Early rise upwards into resistance levels and a move down into support levels and then more consolidation within the Weekly ranges.

As pointed out in the Weekly report, the Australian market looks well supported, however, what’s going to drag the Aussie market lower is the price action in US markets

I’ve bearish on the S&P 500 this week, however around the Weekly lows becomes a random support level, that’s either going to provide a swing low based on reliability of the pattern working as normal…

Or

After 2-days of trying to break 1098.50 along with Thursday’s down day (as expected), the trend can often break out of the weekly lows on Friday and continue to trend lower over the coming week.


S&P (e-mini ) 19th August 2010 recap

"Keep an eye on price trading below 1084.75 on Thursday for a delayed sell off.

I'm bearish After a 2-day failure to break 1098.50, with a view of moving into a lower Weekly close by Friday"


S&P Weekly and Daily range

Thursday's continuation of the downtrend had to be verified with a break of 1084.75.

Expectation that the trend is moving lower on Friday


SPI Daily 19th August 2010 recap

"SPI currently trading around higher timeframe 50% levels, which are currently forming resistance zones.

Trend guide 4457.

Below and the trend bias is to move down 42 points towards 4424"


SPI Weekly and Daily range

Early resistance moving down from 4456 but not completing the entire 42 range (low 4429), and another tight trading day.

After hours has seen buying push the futures upwards into a higher daily close but still around resistance levels.

The rest of this week is based on the direction the S&P 500 takes, and I would have favoured more downside if the S&P 500 continued down during globex hours and already trading below 1084.75 by Thursday midnight NY time, but that’s not the case.


S&P (e-mini ) 18th August 2010 recap

"The price action suggests a rise upwards today using the daily 50% level and 1084.75 as support:- minimum move 8.5 points ($425 USD)

1098.50 is the critical level during the 3rd Quarter in the S&P 500"


S&P Weekly and daily range

Support and rise upwards hitting 1098.50 and being sold down once again.

Current price action is still trading above 1084.75, but I’d keep an eye on globex trading, because below the daily 50% level on Thursday price is likely to be sold down .


SPI Daily 18th August 2010 recap

"Price has already hit Wednesday highs during sycom @ 4491, therefore it is hard to see further gains in the Australian Market today,

Spiral top @ 4778, could see an initial move down 21 to 42 points"


SPI Weekly and Daily range

Price moved up in early trading and into the precise Spiral top @ 4478 resulting in a push down of 21 points and then a continuation into a precise 42 point low.

The rest of the day remained in a tight 21 point range between key Monthly and Weekly levels.

Once again any further gains will depend on the S&P remaining above 1084.75


S&P (e-mini ) 17th August 2010 recap

"No probability in today's trading but 1084.75 is the key level on whether Tuesday continues down into support levels:- Weekly lows

Or a move upwards into a higher daily close, with a possible weekly HOOK pattern"


S&P Weekly and Daily range.


Tuesday continued upwards but hit a brick wall around 1098.50-1099, which is the trend guide for the 3rd Quarter.

A Weekly HOOK pattern normally occurs on Tuesday, which is a daily close above the 5-day 50% level and 3-week 50% level, and often leads to a higher weekly close by Friday.

At this stage it is too early to tell whether it’s A HOOK pattern because the daily close needed to be above 1091.50.


  • Daily Trading Set-ups & Analysis


  • Index Futures SPI, DOW S&P, & Forex


  • Subscribe to the Trader Premium


  • http://www.datafeeds.com.au/premiumtrader.html


    • SPI Daily 17th August 2010 recap

      "Today is based on whether the trend continues higher and back to the
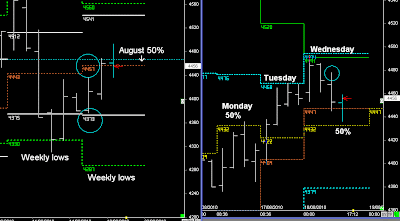
      August 50% level @ 4457-67

      Or whether 4422 pushes the market back down.

      Trend guide 4404."


      SPI Weekly and Daily range.

      Early support @ 4404 set-up a move back into 4422, which then resulted in price moving above the 50% levels for the first time in a number of days, and has seen the trend continue towards higher highs on Tuesday.

      Australian market continues to look well supported (above the Yearly 50% level @ 4295), as 3-week lows is often a robust swing low during the month, but it’s not a forgone conclusion that the trend will continue higher because price is still below key monthly and quarterly levels

      At the moment we have a 2-day swing pattern from a lower Weekly open into resistance levels and a continuation of 3rd Quarter consolidation.

      It’s now it’s up to the S&P to decide if the trend continues higher or not, as the S&P remains below key Weekly levels @ 1084.75


    • Daily Trading Set-ups & Analysis


    • Index Futures SPI, DOW S&P, & Forex


    • Subscribe to the Trader Premium


    • http://www.datafeeds.com.au/premiumtrader.html


      • S&P (e-mini ) 16th August 2010 recap

        Around 1084.75 could send the S&P back down into 1072, which then becomes random support:- choppy

        Support 1062.75 (Weekly lows).


        S&P Weekly and Daily range

        Choppy trading between the Weekly levels without reaching the resistance (1084.75) or support (1062)


        SPI Daily 16th August 2010 recap

        Monday's trading is going to be based around the levels @ 4373

        If above looking for a swing back towards 4432.


        SPI Weekly and daily range

        SPI currently remains range bound within the Weekly levels and swing trading within the 5-day range.

        Early rise with a target around the next spiral filter @ 4332, but the weekly 50% level stalled price @ 4424.

        As pointed out in the Weekly report, the Aussie market looks well supported, but what’s going to drag the market lower is the price action in the S&P 500.