S&P (e-mini ) 21st April 2011 Daily recap.

Resistance 1335

Whilst below the expectation is that price is moving back towards the Daily and Weekly 50% levels @ 1319.50


S&P Weekly and Daily range

Resistance only lasted 8.5 points, without moving down into support levels in the daily range.

The S&P 500 is once again trading around the upper Yearly level @ 1331, which continues to form resistance during the months of February, March,  & currently April


SPI Daily 21st April 2011 recap

Resistance 4921-26

Looking for the SPI to close yesterday’s gap (42 points)

Above 4926 could see a continuation towards the weekly highs.

 
SPI Weekly and Daily range…


Resistance was based on Thursday's highs and also the Weekly level, but it only lasted 21 points, and not the usual 42 points.


Any further gains towards the weekly highs @ 4997 will be helped or hindered by the price action in the S&P 500 overnight


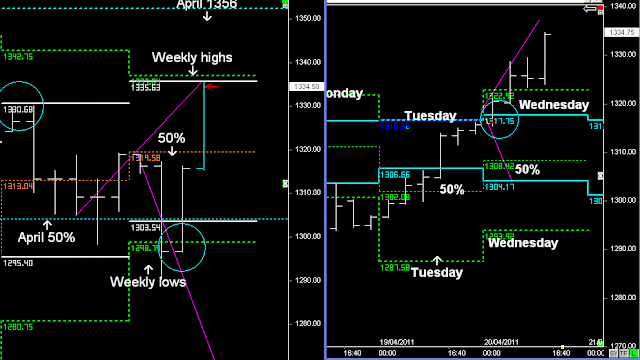
S&P (e-mini ) 20th April 2011 Daily recap.

Resistance:- 1317.75 :- 8.5 to 14 points

Support 1304.

We can see the Weekly highs have a 'drop' formation (lower highs than the previous Weekly highs), often when the previous day doesn't continue down but instead move upwards, the rest of the week can continue to move towards higher highs by Friday

Price will need to move above the Weekly 50% level, and then breakout of the 5- day highs...


S&P Weekly and Daily range

At the start of the globex session that market was below the Weekly 50% level and channel highs @ 1317-1319...

 therefore the initial expectation is that price will try and move lower 8.5 points, and possibly retest the lower channel @ 1304 (14 points), which matches higher timeframe support levels.


However, as pointed out in the report, I’ve seen these patterns rally towards higher highs by Friday, with the first move above the Weekly 50% level, and a continuation towards the Weekly highs.

These Weekly highs are seen as random resistance (1335), with a possible continuation of the trend towards the April highs next week.


SPI Daily 20th April 2011 recap

The Spiral filter and daily filters match @ 4813-15

Whilst above that level, the first target is 4841 (5-day 50% level)...

and then keep an eye on whether a late move will take it towards 4855-59


SPI Weekly and Daily range

The SPI didn't open low enough to get a robust long trade off support @ 4813-4815...

 it wasn't until after 11.20 once price started moving above 4841,  thus completing the gap closure @ 4855-59.

There was another pattern that could have played out using the previous daily lows @ 4834.

that being, a retest of 4834 and a intra-day close below 4813 would have been part of a move down towards Wednesday's lows @ 4770, that matched the Weekly level @ 4769 

Any further gains in the SPI, as it's above the Weekly 50% level, will be helped or hindered by the price action in the S&P 500 overnight


S&P (e-mini ) 19th April 2011 Daily recap.

Daily close below the Weekly lows, and also support levels @ 1300-1304

Breakout of the 5-day lows on Monday, normally will continue to extend down towards Tuesday lows.

Resistance 1306.50


S&P Weekly and Daily range…

Nothing is ever 100% guaranteed when trading the markets, and Tuesday’s price action is a perfect example of that.

Using a multitude of timeframes along with breakout patterns in a number of those, this often suggests further weakness in the short-term (Tuesday’s lows) with a possible reversal pattern down towards the April lows @ 1256.

Breakout pattern lasted only 8.5 points outside the daily lows

Once Tuesday started trading above 1303, and then later in the day above 1306.50 short –term patterns suggest a higher daily close, as it goes look for the channel highs.

In fact, it shouldn't have moved above the weekly lows @ 1298.75 during globex hours, so I knew that once above 1306.50, it would swing back towards the highs @ 1316.50 (random resistance)

If that exact same pattern appears later on in this month or the next,  then I’ll have the exact same expectation, that the S&P is moving lower


SPI Daily 19th April 2011 recap

Today's resistance is 4830-4836

There’s a breakout of Tuesday’s lows @ 4834, with the expectation that the trend is moving down towards the lower Weekly level @ 4769.


SPI Weekly and Daily range


SPI following the weekly trend lower after last night’s reversal pattern in the S&P 500, and a break of its support.

I would have been surprised to see the SPI above the 5-day low breakout @ 4834, but if it did, it would have probably failed at the weekly 50% level @ 4855-59 (gap closure)

Once the market started trading below 4814, the trend bias was to follow a move towards lower lows….

How the S&P responds to Yesterday’s reversal pattern will dictate how low the SPI moves over the coming day, but first it needs to be trading below 4740 (read Weekly index report)

And the S&P remaining below 1300-1304


S&P (e-mini ) 18th April 2011 Daily recap.

Weekly 50% level and channel highs are the trend guide… 1319-1316

Channel lows random support

Keep an eye on a daily close below the Weekly lows @ 1299


S&P Weekly and Daily range.

As noted in the S&P 500 Weekly report...


Because of the shift in the Weekly lows, there is now greater chance of a


larger reversal pattern towards lower Support levels @ 1247-54, if there is a daily


close below those Weekly lows @ 1299


We currently have that pattern playing out, along with a breakout of the 5-day lows

on Monday, which will often extend towards lower lows in the following day....


Standard & Poors came out with a negative outlook on the US economy, which help set-up Monday’s down day, and breakout of the daily lows.

The current price action has the market below the critical support levels (1300-1304), along with being below the 5-day low:- potential break and extend pattern

As noted in the Weekly report, below key support levels and the trend bias is down towards the April lows @ 1256, as the first target.


Note:- Standard & Poors came out for the first time with a negative outlook

on US AAA credit rating, which if it spooks the market further, then look for a larger reversal
pattern towards 1173-1185.


SPI Daily 18th April 2011 recap

I'm treating the market as consolidating between the Weekly 50% level @ 4855, and the upper weekly level 4926 during the first 2-days this week.

Set-up # 1 :- moves down from 4883 towards support (4852-56).....

finds support, and then gradually rises upwards after 11.20 towards 4891 (42 points), and then 4905.


SPI Weekly and Daily range

Monday’s trading played out as per Pre market report, without the late rise towards 4905.

Current expectation remains that the SPI is moving up towards 4929 (2nd day), but only if the S&P remains stable overnight, without closing below 1299