Index Futures & Stock Reports 16 Jan 09

Weekly Index & Forex Reports out now...

Australian Index (SPI) Futures

http://austindex.blogspot.com/


DOW and S&P Index Futures


http://usindexweekly.blogspot.com/

EUR/USD, AUD/USD

http://www.forexspread.blogspot.com/


OIL Futures:- OIL BOIL

http://www.oilboil.blogspot.com/


Note: Weekly BHP, RIO, and Banking Report Update


DOW Futures Daily 11th Jan 2009 recap

"As per Yesterday’s post, my view is that the US markets should reverse down from these levels and continue lower. The price action in the DOW on Thursday helps validate that view.

And the S&P should follow.

Ideally I would like Friday to close back around the Daily lows"


Premium Trader


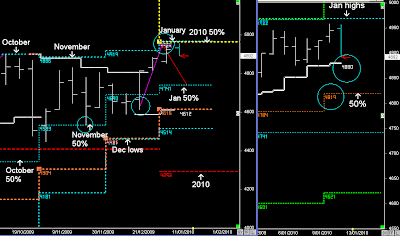
DOW Weekly and 5-day pattern.

Precise high in the DOW around the January highs and Friday follows a 5-day pattern reversal into the daily lows, and as the purple lines show in the chart I’m expecting the trend to continue down next week.

2nd Validation of the trend moving lower will be price trading below the Weekly 50% levels.

The price action on Friday if occurring anywhere else in the Secondary trends can often set-up further gains at the start of next week:- 5-day support and above the Weekly 50% levels and the continuation of the Trend (UP)

If the next session in the market closes higher, my view of the market going down could be wrong, but little things can grow into big things and the current price action that is occurring over the past 2 weeks is acting in a manner that often leads into big things.


If the next session closes on its lows, but not necessarily below the Weekly 50% levels, then the next day might be the start of the market continuing down.

Monday: public Holiday in the US


  • Daily Trading Set-ups & Analysis

  • Index Futures SPI, DOW S&P, & Forex

  • Subscribe to the Trader Premium

  • http://www.datafeeds.com.au/premiumtrader.html


  • SPI Daily 15th January 2010 recap

    "Friday is part of the 2nd day counter-trend move, which is either going to close higher or back around the 5-day 50% level and end up as a 2-day 'stall' pattern.

    Support 4887"


    Premium Trader.


    SPI Weekly and 5-day pattern.

    Even though I’m bearish on the market, based on where price was opening on Friday (above the 50% level) @ 4887, I viewed Friday as a 2nd day stall with the next leg down potentially beginning next week.

    No set-up to trade shorts on open as price didn’t match intra-day resistance levels or a spiral top until around 4912-19

    “I won't discount the SPI actually moving upwards and completing a R42 high.

    More often than not a down trend will continue from a R42 high and also resistance.

    That resistance is now the 5-day 50% levels (4882-87).

    Therefore a R42 point rise can match resistance levels.”…...Intra-day report 12:00 pm


    Short-term buying support after 3pm and swing back into the 50% levels (R42 points up.@ 4881)....

    And Friday ends up a 2nd day stall pattern, and above the Weekly 50% levels.

    The potential next leg down will be based on the price action in the US markets coming into the long weekend.


    • Daily Trading Set-ups & Analysis

  • Index Futures SPI, DOW S&P, & Forex

  • Subscribe to the Trader Premium

  • http://www.datafeeds.com.au/premiumtrader.html


  • S&P (e-mini ) 14 JAN 2010 Daily

    "The reversal pattern down from the highs will probably remain above the previous week’s highs @ 1133 and remain supported. That means the trend can continue higher, or for the next 2-days ‘chop’ around these monthly highs within the daily range.

    If there’s going to be a reversal pattern, it’s probably going to occur next week not this week"

    Premium S&P Weekly and 5-day pattern

    US markets remain supported but currently around resistance levels, and at this stage the market is choppy around these highs in January within the daily range.

    I’ll have a fair idea if there is going to be a reversal pattern next week by the price action on Friday.


    • Daily Trading Set-ups & Analysis

  • Index Futures SPI, DOW S&P, & Forex

  • Subscribe to the Trader Premium

  • http://www.datafeeds.com.au/premiumtrader.html


  • SPI Daily 14th January 2010

    "I can’t see the market rising higher than 4871 today, but it won’t surprise to see Thursday and Friday higher:- Basically there is a potential 2-day counter-trend move from tomorrow, and then a next leg down next week:- market is above the Weekly 50% levels" ...(Previous day’s report)

    "If the price action in the SPI today follows my view of higher prices on Thursday, then the SPI should rise upwards from 4878 and continue towards 4909" ...(Today’s report)


    SPI Weekly and 5-day pattern

    First day of a 1-2 day counter-trend, remaining in a tight trading range between the levels in the 5-day pattern @ 4878 & 4909.

    Price action is above the Weekly 50% levels, below the January highs, and currently in a 3-day sell cycle

    As this stage this is viewed as a short-term up move and a 'stall pattern', with the potential of more weakness if certain patterns align in the US markets align over the next 2-days.


    • Daily Trading Set-ups & Analysis
  • Index Futures SPI, DOW S&P, & Forex
  • Subscribe to the Trader Premium
  • http://www.datafeeds.com.au/premiumtrader.html


  • S&P (e-mini ) 13 JAN 2010 Daily recap

    "I'm expecting a short-term reversal pattern from these levels next week, but by Wednesday if price is still trading above 1133, the market looks well supported "....(Weekly report)

    "The market tested last Week's high breakout @ 1133 and found support, which could lead to higher prices this week"... (Daily report)


    S&P Weekly and 5-day pattern

    Upwards bias after the first short-term reversal down, (2-day pattern)and above 1133.

    Market looks supported for this week as per the Weekly report, and in yesterday’s recap…

    “The next 3-days remain within the 5-day range. (5-day pattern day trading)

    And then align the next set-up with next week”

    I’d be extremely interested in how the market trades over the next 3-days.


    If Monday is trading anywhere near the 5-day lows next week, I wouldn’t go near any longs for the rest of the following week.


    SPI Daily 13th January 2010 recap

    "We have a breakout of the range @ 4884 and there is an expectation that a breakout pattern will extend down towards the Wednesday lows @ 4815, which match the Weekly 50% level @ 4815-19

    Resistance @ 4877 (Note:- R42 high 4871)

    Therefore the trading range is 4815-4871.

    Trend guide 4855 expectation to push down 21 points, and then towards 4815"


    Premium Trader


    SPI Weekly and 5-day pattern


    Early push down from 4855 and 21 points, but the rest of today remained in a tight sideways pattern, rotating in 21 points ranges

    “I can’t see the market rising higher than those levels today, but it won’t surprise to see Thursday and Friday higher:-

    Basically there is a potential 2-day counter-trend move from tomorrow as the market is above the Weekly 50% levels”
    .....morning report

    Depending on the price action in US markets, and even though I have a view of a larger Trend reversal from these January highs, it won't surprise me to see a 2-day counter-trend move starting from tomorrow.

    That will depend on where the market opens tomorrow....


    S&P (e-mini ) 12 JAN 2010 Daily recap

    S&P Weekly and 5-day pattern

    That completes the short-term 2-day reversal pattern to begin the week....

    Even though I'm bearish around these upper levels looking for a larger trend reversal, it wouldn't surprise me to see the next 3-days remain within the 5-day range. (5-day pattern day trading)

    And then align the next set-up next week.


    • Daily Trading Set-ups & Analysis

  • Index Futures SPI, DOW S&P, & Forex

  • Subscribe to the Trader Premium

  • http://www.datafeeds.com.au/premiumtrader.html


  • SPI Daily 12th January 2010 recap

    "I’m still treating this week's higher open as part of a 2-day sell pattern

    Trend guide 4933 with the expectation price is pushing down into 4904.

    This will complete the R42 range, which will put it below the 5-day 50% level, and expectation price is trying to move towards the Tuesday lows"


    Premium Trader


    SPI Weekly and 5-day pattern

    2-day reversal has completed in the 5-day lows on Tuesday.

    As per my Weekly post, my expectation was to begin this week with a short-term reversal pattern (2-day) with the first confirming pattern a move below the 5-day 50% level.

    This occurred on the 2nd day @ 4919

    2nd confirming tool on a potential reversal pattern will be a close below the cycle lows @ 4880, but this has seen support Tueday.


    SPI Monthly and Weekly

    As per my end of year post around 4956-68 is a major resistance level in the Aussie market in 2010, and I have a view of a larger trend reversal other than the usual medium term monthly reversals we normally see each Quarter.

    Resistance was tested overnight in Sycom and subsquent 2-day reversal back down.

    Around these upper levels in the market I just can’t be bullish, unless the market begins to consolidate above 4956 for a number of weeks. Therefore the view during this Quarter is to make its way back towards the 50% levels in January

    The reversal pattern in the S&P 500 isn’t as robust as a normal reversal pattern goes, because the confirming pattern on Monday found support on the 5-day 50% level when it should have closed below:- break and continue on Tuesday

    Anyway, the initial view was a 2-day reversal, and 2-days doesn’t make a major reversal but it can lead to a potential continuation of my view over the next 5-days.


    • Daily Trading Set-ups & Analysis
  • Index Futures SPI, DOW S&P, & Forex
  • Subscribe to the Trader Premium
  • http://www.datafeeds.com.au/premiumtrader.html


  • S&P (e-mini ) 11 JAN 2010 Daily

    "Breakout of the highs on Friday @ 1133 can often push upwards into this week’s highs @ 1149.

    Expectation of a 2-day reversal at this stage doesn’t look like happen, as Monday should have remained below Friday’s highs.

    Random resistance around the Weekly highs, which may end up resistance but remaining above Yellow support"


    Premium Trader


    S&P Weekly and 5-day pattern

    First day reversal, but I’ll classify Monday’s trading as a 1-day stall pattern around the highs.

    Even though my expectation is that these highs are resistance levels with an expectation of a reversal down, after last week’s breakout above 1133 that might not happen as it has changed the dynamics and the price action. (Weekly Report)

    Tomorrow is the 2nd day, but if there was going to be further weakness this week, Monday should have closed below the 5-day 50% level.

    At this stage it's to concentrate of the price action within the 5-day patterns and take chunks out of the ATR.


    • Daily Trading Set-ups & Analysis
  • Index Futures SPI, DOW S&P, & Forex
  • Subscribe to the Trader Premium
  • http://www.datafeeds.com.au/premiumtrader.html


  • SPI Daily 11th January 2010 recap

    "SPI will be opening around 4927 and the upper channel in the 5-day pattern.

    Below 4927 and expectation of a R42 reversal down, which will close below the 5-day 50% level and part of a 2-day reversal pattern.

    Above 4927, and random pattern around Monday’s highs"


    SPI Weekly and 5-day pattern.

    As per Weekly report, I was looking for the start of a 2-day reversal pattern from this Week’s higher Monday open.

    A R42 down move would have placed it below the 5-day 50% level, as part of the first confirming pattern, but once the S&P 500 in the US started to push above 1142 during Sunday hours the SPI followed the same price action into Monday's highs.

    Even though I respect the trend around these upper levels in the market, I can't trade longs around resistance levels.

    If US markets continue to move higher (above 1142), then the SPI will try and make its way towards 5018.