Index, Forex, Stocks 5th Feb 2011 Weekly

Weekly Index & Forex Reports out now...

Australian Index (SPI) Futures

http://austindex.blogspot.com/


DOW and S&P Index Futures


http://usindexweekly.blogspot.com/

US Dollar INDEX, AUD/USD, EUR/USD

http://www.forexspread.blogspot.com/

OIL Futures:- OIL BOIL

http://www.oilboil.blogspot.com/


Note: Weekly BHP, RIO,  Banking Report Update


S&P (e-mini ) 4th February 2011 Daily recap.

Support around 1297/99 for a push towards higher highs (February highs)

Resistance @ 1312/16


S&P Weekly and Daily range.

Early support and a 8.5 point rise towards Friday's highs.

However, it failed to continue towards the Monthly highs @ 1316, which it's likely to be reached early next week.


SPI Daily 4th February 2011 recap

I have the view that the market is continuing towards the Weekly highs @ 4816/18, and then towards next week’s highs, which matches the February highs @ 4849.

Support 4788


SPI Weekly and Daily range.

The SPI has completed the move into the monthly highs @ 4849, validated by the breakout of the Weekly highs @ 4816/18

At the start of the trading day my view was an upwards trend, but I was leaning towards the market following an orderly pattern within the Weekly ranges.

Whereas today, the market completed the move with a breakout pattern on the last day of the Week.


S&P (e-mini ) 3rd February 2011 Daily recap.

whilst above the Weekly highs @ 1297, expectation the trend is continuing towards the February highs.

Random support 1289


S&P Weekly and Daily range.

Early weakness, but a failure to move down into 1289, and the daily 50% level.

Trend bias is to complete the double monthly high pattern in February @ 1316, whilst the market remains above the Weekly highs @ 1297


SPI Daily 3rd February 2011 recap

above the Weekly 50% level & the bias is to continue higher

it lends its self to more upside using 4761 as the trend guide:- 42 points upwards


SPI Weekly and Daily Range.


As the market is trading above the Weekly 50% level, expectation is that the the trend is continuing towards the Weekly highs

Early support @ 4761, but a failure to reach the 42 point target during the day session & Thursday’s highs


S&P (e-mini ) 2nd February 2011 Daily recap.

With the S&P trading above 1298 (weekly highs) my view is that the trend should continues towards 1316


Resistance 1312-1316


S&P Weekly and Daily range.

With Tuesday’s daily close above the Weekly and Daily highs, my view was that Wednesday would continue to move upwards, as part of a break and extend pattern

Instead it remained flat, and trading around it’s 2011 primary highs @ 1300

Around 1312/16 is seen as resistance, simply because it completes the double monthly high pattern during the current Quarterly cycle.


SPI Daily 2nd February 2011 recap

keep an eye on is the previous brown filter @ 4775

if above this level it will continue to push upwards today.

if not it is likely to push down towards support levels @ 4745 (Weekly 50% level)


SPI Weekly and Daily range

With the market trading above the Weekly 50% level @ 4745, the expectation was that the trend was moving up towards the Daily highs @ 4798

Early rise upwards of 21 points, but then it struggled to rise higher than 4775, drifting lower into the close and remaining in a tight 21 point range.


S&P (e-mini ) 1st February 2011 Daily recap.

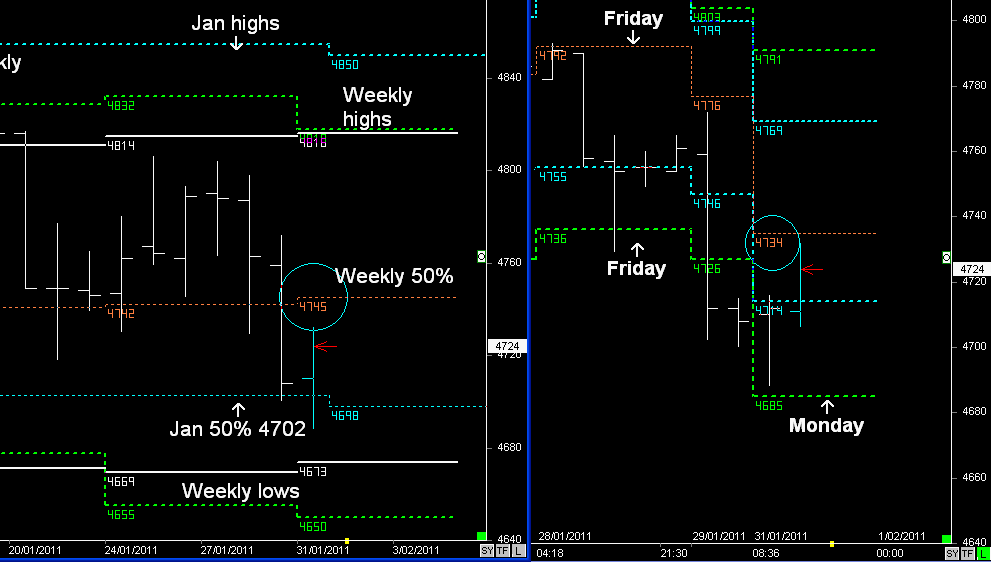
"Monday's price action suggests there is more upside in the markets, as the DOW is pushed up from the Weekly 50% level, whilst the S&P closes above the Weekly 50% level.

And January's monthly highs (resistance) have now disappeared, so there is the potential for the trend to continue towards the Weekly highs, and then push higher towards the February highs."


S&P Weekly and Daily range.

Monday’s price action and the shift in the Monthly resistance levels in January have allowed the S&P to make higher highs,

This was helped with Monday's reversal from the Weekly lows and then the daily close above the Weekly 50% level @ 1280.

And with price now currently trading above the Weekly highs @ 1298, the trend bias is to continue towards the February highs, with upside targets being 1316, and as high as 1331.

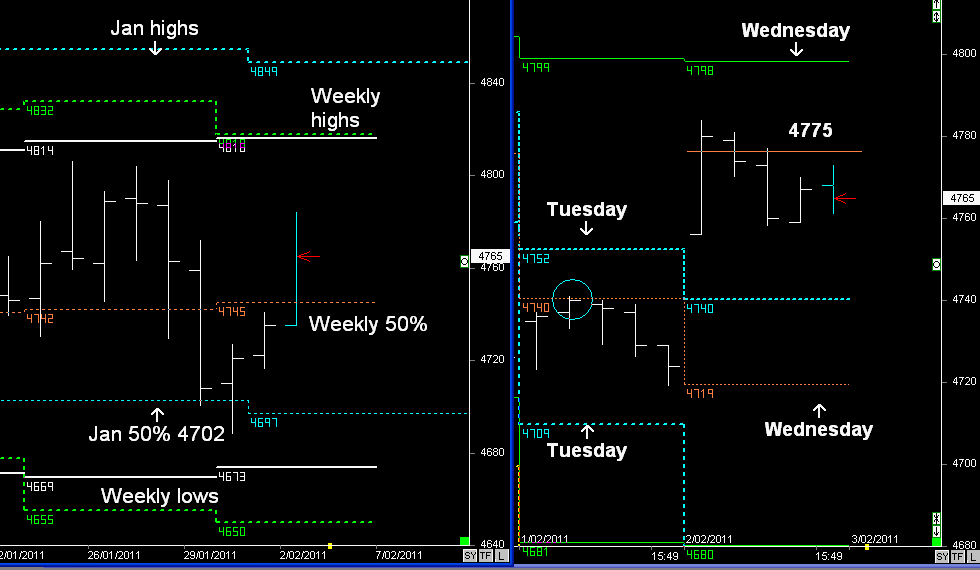
However, as per Weekly report, my view for the S&P was to reverse down into the monthly 50% levels before the trend would continue upwards.

And at the start of the day, my resistance zones were 1287-1290 using levels in the daily range, with the expectation that price would move back down into 1274.75, and then continue to move down towards the February 50% level by the end of the week.

If the market was going to go higher using text book patterns, it would find support @ 1274.75 on Tuesday and then continue higher on Wednesday, forming a HOOK pattern, and then continue rising upwards from the Weekly 50% level.

But that changed once the market started trading above the daily channel high @ 1290, & the trend has simply followed the change in monthly dynamics, upwards, as resistance levels have now moved.


SPI Daily 1st February 2011 recap

Because of the current levels in the Weekly and Daily range, my view is that Tuesday can remain range bound between 4746 (high) and 4709- (low)

Trend guide 4740


SPI Weekly and Daily range

The SPI has struggled to rise higher than key levels in the Daily range. (4740), and has drifted back down towards the lower support levels.

Even though the market  remains above the monthly 50% levels, it is the price action in the S&P 500 overnight that’s going to determine whether there is more weakness.

As per US report put out at mid-day today…..


Therefore if it follows my gut feeling of reversing down, then the S&P will hit 1286.50 to 1289.75 and reverse down, with a minimum move @ 1274.75...

And then with the possibility of moving back down into the Weekly lows @ 1255 later this week


So far the S&P hit a high @ 1288 during globex hours, and there has been some minor selling,

It will now just need to move back below the Weekly 50% level.


S&P (e-mini ) 31st January 2011 Daily

There are two possible patterns for Monday

1. Because there is a breakout of Friday’s low, the S&P can revisit the breakout @ 1278 and then continue down into Monday’s lows


#2 continues back towards the Weekly 50% level @ 1280 and a higher Monday close:- 1284


S&P Weekly and daily range.

S&P has followed a higher Monday close back towards 1284.

My hunch was that the S&P would follow that pattern, simply because this week’s lows @ 1263 have already been reached, and the market is following a reversal pattern within the daily range.

Tomorrow starts the new month of February, and because there is a Daily close above the Weekly 50% level, we could see the S&P continue back towards the Weekly highs, and then make higher highs in February.

However, anything below the Weekly 50% level, and the expectation is that the market is moving down into the February 50% level, as per Weekly report.


SPI Daily 31st January 2011 daily recap

my view is that today will try and move upwards.

critical support levels are 4699/702

trend guide is 4714-15

First target 4734


                                                                    SPI Weekly and Daily range.

Early selling pressure, as the market was sold from 4715, towards Monday’s lows

However, once the market settled back above support levels, the trend bias was to move upwards, and continue back towards 4734.

Market remains supported above the January 50% level @ 4702.

Any further gains in the SPI will be determine whether the S&P closes upwards on Monday…

Or fails to rise higher than 1278.50, as the market is now trading below the Weekly 50% levels, as per Weekly Report.