Index, Forex & Stocks 18 Sept 2010 Weekly

Weekly Index & Forex Reports out now...
Australian Index (SPI) Futures

http://austindex.blogspot.com/


DOW and S&P Index Futures


http://usindexweekly.blogspot.com/

US Dollar INDEX, AUD/USD, EUR/USD, GBP/USD

http://www.forexspread.blogspot.com/

OIL Futures:- OIL BOIL

http://www.oilboil.blogspot.com/


Note: Weekly BHP, RIO, and Banking Report Update


S&P (e-mini ) 17th September 2010 recap

There is a breakout of Thursday's highs which should see Friday continue higher:- Friday's highs are seen as resistance.

plays for Friday....

#1 Reverses down into the daily lows @ 1112

#2 Reverses down into the 5-day 50% level @ 1121.50, but should continue down as part of a 2-day reversal pattern from next week.


Premium Report


S&P Weekly and daily range

Reversal down from Friday's highs closing below the 50% level...

 and based on the current price action there's an expectation that the reversal pattern will continue for the next 2-days.

If below 1116  the 2-day reversal pattern would be down towards the Weekly 50% level @ 1097.

Otherwise next week can move into a 2-day sideways pattern, with the trend guide being 1116 for any further gains thereafter.


SPI Daily 17th September 2010 recap

Because price is above the filter @ 4644, there could be a trend bias upwards


Resistance 4678-81 (Weekly highs)

                                                               SPI Weekly and Daily range

Early support @ 4644 with an upwards bias (high 4676)

Around 4672-76 are higher timeframe resistance levels, as shown in yesterday's chart.

Any further gains in the SPI will be dependant on price action in the S&P 500 on Friday.

S&P 500 is now trading above 1123-1126:- key resistance levels for this week

Weekly report out tomorrow.


S&P (e-mini ) 16th September 2010 recap


No probability pattern for Thursday :- use the levels in the daily range.

December futures still trying to move up towards resistance levels @ 1123-26


S&P weekly and Daily range

Early resistance around channel high @ 1119 pushed the S&P down into the daily 50% level.

And then a late rise up into the weekly highs, and most likely into the September highs on Friday


SPI Daily 16th September 2010 recap

Resistance:- 4693-96.

First Target is 4660.

Keep an eye on a close below 4660, as the next level down is 4628


Premium Report


SPI Monthly and Weekly

Higher daily open and a larger reversal pattern down into the 5-day 50% level @ 4628.

Today was a high probability reversal pattern, with an expectation of a large trending down day once price had closed below 4660.

As per Weekly Report 4672-76 is a critical level:- Quarterly midpoint and the September highs

The way I’m looking at the market is, further gains in the 4th Quarter towards 4895

However, I would like to see either a retest of the September 50% levels...

or a drop in the 4th Quarter midpoint for the next leg upwards.

Once again my view is either going to be helped or hindered by the price action in the S&P 500


S&P (e-mini ) 15th September 2010 recap

Resistance 1123-1126.

At this stage the December futures look to be moving up into the highs on Wednesday.


S&P Weekly and Daily Range.

Early selling pressure on Wednesday, but I wasn’t factoring a continuation down without the December futures reaching the Weekly and Monthly highs.

Currently SPOT futures is providing resistance, but that will end on Friday..


SPI Daily 15th September 2010 recap

Trend guide 4642.

This is either going to push the SPI down towards 4605

Or price is going to move up towards 4666-72 (resistance)


SPI Weekly and Daily range.

SPI moves upwards and completes the 3rd Quarter target @ 4672, as per Weekly report.

Any reversal down will be dependant on price action in the S&P 500.

This moves completes a 3rd Quarter rise and the next long set-ups won't align until the next quarter.

That doesn't mean the market will reverse down from this point, because certain minor patterns need to verify any reversal pattern (5-day low breakout).

It just means I wouldn't be buying back in the market on the long side until there is a pullback during the next Quarter.


S&P (e-mini ) 14th September 2010 recap

"Resistance on the S&P @ 1123.50 to 1126

Support 1112.50"


Premium Report


S&P Weekly and Daily range

As per Daily report:- Two patterns at play on Tuesday.

#1. moves up into the highs and reverses back down into the 50% level.

This can set up another sell pattern on Wednesday.
#2. Moves down in 1112.50 first...

and then continues up into 1123.50 to 1126


What happened was 1112.50 provided support for a test of the highs and then a reversal back down.

September Futures has reached the resistance levels, but the reversal back down didn't move to the daily 50% level.

Because of this it's too early to tell whether Wednesday will provide another 'sell' pattern.


SPI Daily 14th September 2010 recap

Resistance 4650 (Tuesday’s highs)

Support 4618


Premium Report


                                            SPI Weekly and daily range.

Break and extend pattern from Monday’s highs into Tuesday highs @ 4650

Expectation of resistance around 4650

With a minimum pullback of 21 points, and as low as 4618

However, the September highs @ 4628 have ended up supporting Tuesday, which wasn’t unexpected.

"Because price is now trading above the September higher @ 4628, if the SPI begins rising up from 4631 then there is a possible continuation up towards 4672 in late trading & sycom:- SPI 11:25am"

As per Weekly report, upside target @ 4672 is dependant on price action in the S&P.

As per Weekly report, the loss of momentum in the SPI is also dependant on the S&P, and how the S&P 500 responds to it’s own Weekly and Monthly highs this week.


S&P (e-mini ) 13th September 2010 recap

Trend bias is to move up towards the Weekly and monthly highs.

Daily and weekly highs Resistance.


S&P Weekly and Daily range

Trend continues upwards with the daily highs providing some resistance until late in the trading day, and Monday's range will dynamically shift higher on Tuesday to match the first targets.

As per Weekly report... Trend bias is to continue up into the Weekly and Monthly highs, as the first targets.


SPI Daily 13th September 2010 recap


"The trend guide for the day session is 4577-79.

Either price continues upwards or it loses momentum and drops back down into 4560

Next spiral filter @ 4619"


SPI Weekly and Daily range.

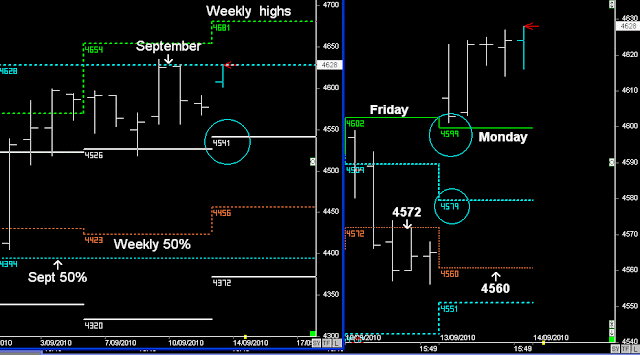
SPI opened much higher than expected, and above the 5-day highs @ 4599: - resulting in a breakout pattern

The next spiral filter @ 4619 provided a 21 point reversal down, but the rest of the day remain in a ‘breakout’ pattern and under the September highs. @ 4628

Further gains in the SPI will be dependant on the S&P moving upwards on Monday towards the Weekly and Monthly highs.