Index, Forex, Stocks 16th April 2011

Weekly Index & Forex Reports out now...

Australian Index (SPI) Futures

http://austindex.blogspot.com/


DOW and S&P Index Futures


http://usindexweekly.blogspot.com/

US Dollar INDEX, AUD/USD, EUR/USD

http://www.forexspread.blogspot.com/

OIL Futures:- OIL BOIL

http://www.oilboil.blogspot.com/


Note: Weekly BHP, RIO, TLS, Banking Report Update


S&P (e-mini ) 15th April 2011 Daily recap.

Trend bias is to continue down this week, using the Weekly 50% level @ 1313 as a trend guide


but based on the daily channels @ 1307, and the market remaining above 1300-1300 Friday could push higher


S&P Weekly and Daily range

Market continues to remain above 1300-1304, and the change in the daily pattern  provided the S&P more of a reason to closer higher.

Weekly Report out later


SPI Daily 15th April 2011 recap

There is a bias to move upwards in early trading using 4891 as support, and back towards 4922, which is seen as resistance

Therefore, the first targets exits are 4902, and then 4920

Note:- if the market fails at 4903 and closes below 4891 the trend bias is down towards 4857. (Friday lows random support @ 4850-57)


SPI Weekly and Daily range…

Early rise upwards from 4891, but the market failed to remain above 4903.

Once price move back below 4891, the trend bias was towards Friday’s lows, as part of a move towards the Weekly level @ 4841 from the highs in April @ 4978


S&P (e-mini ) 14th April 2011 Daily recap.

Resistance 1313

Thursday can remain choppy as the market remains above 1300-13004

Support 1296


S&P Weekly and Daily range

S&P continues to remain within the daily channels. as the market remains above 1300-1304

1313 stalled the market from rising in late trading, without provided another 8.5 reversal pattern.


SPI Daily 14th April 2011 recap

Trend guide 4904

Expectation that the trend is moving down towards 4841, however, based on the levels in the daily range, I'm not sure that's going to happen today.

Resistance 4927


SPI Weekly and Daily range

Early selling pressure from 4904 down into Thursday's lows @ 4875 (random support)...

as the trend continues down towards from the April highs towards the Weekly level @ 4841.


SPI Daily 13th April 2011 recap

I favour a move down into the lows, helped by remaining below last week's lows and also the Daily 50% level

resistance @ 1318-1322 8.5 to 14 points.


S&P Weekly and Daily

S&P moves up early and then continues down towards the lows (14 points), using both patterns as resistance.

However, S&P continues to remain above the critical support levels @ 1300-1304


SPI Daily 13th April 2011 recap

Wednesday will open around the daily lows, with a possible swing up 42 points towards 4936-4940

If below the daily lows, trend bias is down towards 4841

SPI Weekly and daily range


Early support from the Daily lows saw a 42 point rise upwards, and then the rest of the day moved into a consolidation pattern.

Current expectation remains that the SPI will continue down into 4841.

Any further short-term weakness in the SPI will also depend on whether the S&P remains above critical support levels @ 1300-1304, or not


S&P (e-mini ) 12th April 2011 Daily recap.

Monday breakout, therefore there's the expectation that the trend will continue down towards Tuesday's lows: - break and extend

Tuesday's lows, which matches the monthly 50% levels:- Support & a potential higher daily close (daily 50% level).


S&P Weekly and Daily range…


Tuesday’s low support and a 8.5 point rise failed to continue up 14 points towards the Daily 50% level.

Tuesday is now trading below the Weekly 50% level, but continues to remain above the critical support levels @ 1300-1304


SPI Daily 12th April 2011 recap

As noted in the Weekly report, my view is that the Market has reached it’s highs and will begin to rotate back down, helped by the switch in Weekly dynamics in the S&P 500, with this week’s open.

Below 4988, and especially below 4978, we should begin to hold shorts.


S&P Weekly and Daily range.

Market Top and sell pattern with today’s open, and expectation that the reversal pattern is towards the lower weekly levels @ 4841, as shown in the chart on the right.

The SPI pushed up slightly hitting 5006 and stalled

Even though I have a view that the trend bias is up towards 5093 to 5139,  that’s more likely going to happen later in the current Quarter, or the next, after there's a reversal pattern down from these April highs.

There are two possible patterns, and that will depend if the S&P holds support levels (above 1300-1304).

If it does hold support, then I’ll look for the next push upwards from MAY, as the market ‘chops’ around for the next 3-weeks (SET-UP B)

If it doesn’t hold support, and the S&P moves back down towards 1247-54, then the SPI can makes its way back towards 2nd Quarter Support (SET-UP C)


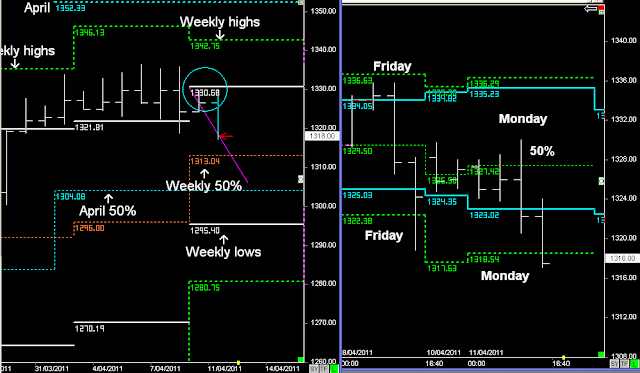
S&P (e-mini ) 11th April 2011 Daily recap.

My view is that this week will move down towards the Weekly levels, and as far as the Monthly 50% level over the next 2-days.

Trend guide 1330.50


S&P Weekly and Daily range

As noted in the Weekly report…

After last week not rising upwards from 1322, and this week opening below the Weekly level @ 1330.50, the trend bias was to rotate back towards lower levels.


SPI Daily 11th April 2011 recap

"Looking for a 2-day reversal back towards lower Weekly levels.

Resistance 4978 (Daily and Monthly highs)

Trend guide 4960"


SPI Weekly and Daily range

As per Weekly report, my view is that the Market has hit resistance levels and would begin to reverse back down towards lower Weekly levels.

However, the resistance levels @ 4978 didn’t push the market back below 4960, instead it has continued upwards…

Whilst above 4978, the bias is to follow the trend towards the Weekly highs @ 5022