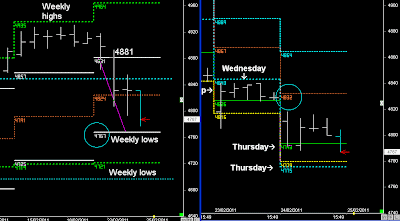
trend bias is defined by 4917.
If it moves down 42 points it will break the 5-day lows. SPI Weekly and Daily range
As per Weekly report, the larger timeframe trend guide is defined by 4881/83.
This was super-seeded by today’s breakout of the 5-day lows, which often extends towards lower lows in the following day.
However, at this stage it’s too early to tell whether the trend will continue down, or whether this is a fake break.
As pointed out 2 weeks ago in the Weekly report, I don’t want to be buying the market at these February highs, and I would wait until the market moves back down into trailing support levels.
And with the market trading below those 5-day lows, this is the first sign of the market reversing down towards lower support levels, but late futures buying after the cash market had closed keeps the SPI above those critical higher timeframe support levels @ 4881/83
- Daily Trading Set-ups & Analysis
Index Futures SPI, DOW S&P, & Forex Subscribe to the Trader Premiumhttp://www.datafeeds.com.au/premiumtrader.html


