Index Futures & Stock Reports 7 Nov 09

Weekly Index & Forex Reports out now...

Australian Index (SPI) Futures

http://austindex.blogspot.com/


DOW and S&P Index Futures


http://usindexweekly.blogspot.com/

EUR/USD, AUD/USD

http://www.forexspread.blogspot.com/


OIL Futures:- OIL BOIL

http://www.oilboil.blogspot.com/


Note: Weekly BHP, RIO, and Banking Report Update


  • Daily Trading Set-ups & Analysis
  • Index Futures SPI, DOW S&P, & Forex
  • Subscribe to the Trader Premium
  • http://www.datafeeds.com.au/premiumtrader.html


  • S&P (e-mini ) 6 Nov 09 recap

    "Being Friday that reversal could be only 1 day, and then continue higher from Monday.

    If there is going to be a daily reversal down then price will extend upwards from Thursday’s 5-day high break and continue into Friday’s highs.

    Any potential reversal down will come from the 5-day highs on Friday back down into the 5-day 50% levels (closing on the lows)
    "

    Premium Report

    S&P Weekly and 5-day pattern

    This week’s UP move had to be verified with the break of the 3-day cycle and trading above the Weekly 50% level.

    Normally when this occurs I would look for a 2-day reversal pattern and then continue higher in the new week using the weekly 50% level as support

    However, being Friday that reversal could be only 1 day, and then continue higher from Monday.

    Therefore my preferred pattern was not to see US markets continue to move higher, but to follow my preferred pattern:- Friday moving up and then closing near the 5-day 50% level, and then trade longs on Monday using the Weekly 50% levels as support.

    The Weekly 50% level is the trend guide for next week, but we are starting the week from the highs


    • Daily Trading Set-ups & Analysis
  • Index Futures SPI, DOW S&P, & Forex
  • Subscribe to the Trader Premium
  • http://www.datafeeds.com.au/premiumtrader.html


  • SPI Daily 6th November 2009 recap


    SPI Weekly and 5-day pattern (day session)

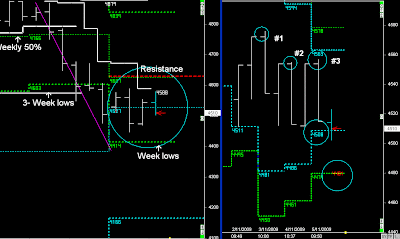
    This week has seen the SPI remain below a number of key levels @ 4575.

    Below the 3-week lows
    Below the 3-day highs
    Below the 3-month 50% levels

    All at the same price @ 4573-76, so this level was an extremely key level for the rest of this week & probably the month.

    Therefore any UP trend to continue needed to be moving above this level and heading towards 4610 (R42 points), continuing towards Friday's highs.

    Trend guide and support 4561 today (5-day 50% level).


    This was helped by US markets moving above their weekly on Thursday following the B SET_UP

    My Preferred pattern today was a rally on open and continuation of the trend upwards on open towards the Weekly 50% level.

    Instead it was choppy around the top for most of the day around 4575 with late buying but a lack of volume until the market closed @ 16.10 and then progam trading kicked in sending the SPI higher into the close.


    • Daily Trading Set-ups & Analysis
  • Index Futures SPI, DOW S&P, & Forex
  • Subscribe to the Trader Premium
  • http://www.datafeeds.com.au/premiumtrader.html


  • S&P (e-mini ) 5 Nov 09 recap

    If US markets are going to follow the November 50% level support levels, then a breakout of the 3-day cycle highs (daily close above), is the pattern that needs to be seen first.

    Daily close above the 3-day cycle and then a 2-day stall above the Weekly 50% level and a move higher next week, using the Weekly 50% level as support.

    Once again it's the 5-day 50% level that's the trend guide...."


    S&P Weekly and 5-day pattern

    S&P continues higher from the 5-day 50% level into Thursday's highs.


    The above report wasn't yesterdays, it was two day's ago, as I expected this pattern to occur on Wednesday and then reverse down into support levels and continue higher next week. (2-day stall)

    So I'm still expecting a move higher in November, as price is above the November 50% levels, but being 1 day late I'm still looking for the short-term reversal that could last only 1 day before continuing higher.


    • Daily Trading Set-ups & Analysis
  • Index Futures SPI, DOW S&P, & Forex
  • Subscribe to the Trader Premium
  • http://www.datafeeds.com.au/premiumtrader.html


  • SPI Daily 5th November 2009 recap

    "The past 2 days has seen the SPI rise upwards in early trading and complete the R42 range in the day session and then reverse back down into a consolidating trading day.

    If that occurs today, then that level is @ 4554.

    if the SPI hits 4554 and begins to drift back down we will probably have another tight trading day :- support 4508

    Should the SPI be trading above 4568, then there is a bias to close higher and continue towards the Weekly 50% level @ 4627"


    Premium Report


    SPI Weekly and 5-day pattern


    We have a tight Weekly range occurring around the November 50% level, trying to work out which direction the SPI will close on Friday.

    The 3-day cycle is bearish @ 4588, that can push prices lower by Friday, resulting in a tight 5-day weekly range around November’s 50% level, or continue down into the Weekly lows @ 4414.

    This is based on the break and extend pattern from last week’s lows down into this weeks lows.

    At the start of the day I didn’t have a view on the direction other than reacting to the price action around 4554 in early trading and trading to price action down into the lows.

    This has been the exact same patterns for the past 3-days, and intra-day has seen the exact same price action.

    At this stage the SPI remains in a tight 5-day pattern, whilst US market continue to consolidate in tight 5-day patterns also.


    • Daily Trading Set-ups & Analysis

  • Index Futures SPI, DOW S&P, & Forex

  • Subscribe to the Trader Premium

  • http://www.datafeeds.com.au/premiumtrader.html


  • S&P (e-mini ) 4 Nov 09 recap

    If US markets are going to follow the November 50% level support levels, then a breakout of the 3-day cycle highs (daily close above), is the pattern that needs to be seen first.

    Daily close above and then a 2-day stall above the Weekly 50% level and a move higher next week, using the Weekly 50% level as support.

    Once again it's the 5-day 50% level that's the trend guide....


    Premium Report


    S&P Weekly and 5-day pattern


    November 50% level support and a move upwards on Wednesday, but back down into the intra-day support levels at the end of the day.

    The rest of this week is going to be defined by 1048.

    As per report, a higher daily close and then 2-day stall above 1048 would normally continue higher next week, but when price spikes upwards and then closes back below, can see more downward pressure resulting in a tight weekly bar range and 5-day pattern around November’s 50% levels.


    SPI Daily 4th November 2009 recap

    Resistance as shown @ 4544.

    I haven’t factored in an UP day,

    Potential down move towards Wednesday’s lows.


    Premium Trader


    SPI Weekly and 5-day pattern


    SPI consolidating in between the higher timeframe 50% levels, along with the levels in the 5-day range.

    Early rise into the resistance levels and the R42 range completion @ 4454, and then the R42 completion on the downside @ 4513


    S&P (e-mini ) 3 Nov 09 recap

    S&P Weekly and 5-day pattern

    S&P trading and consolidating around the higher timeframe 50% levels.

    At this stage there's no probability patterns until the end of the week.


    • Daily Trading Set-ups & Analysis

  • Index Futures SPI, DOW S&P, & Forex

  • Subscribe to the Trader Premium

  • http://www.datafeeds.com.au/premiumtrader.html


  • S&P (e-mini ) 2nd Nov 09 recap

    "Higher timeframes want to go upwards, lesser timeframes want to push down.

    5-day low breakout on Friday, this would often push down on Monday using the 5-day 50% levels as resistance"

    Premium Report


    S&P Weekly and 5-day pattern

    Start of November and both US markets are rising up from the November 50% levels (blue)

    At this stage there is nothing bearish in the higher timeframes, as last week’s reversal down is now viewed as SET-UP B, with the possibility that price is continuing higher in November, or moving in a Weekly rotation patterns of UP and DOWN weekly ranges (consolidation)

    The only thing that needs to be verified is price trading back above the Weekly 50% levels.

    Even though price had opened around the monthly 50% levels, that would normally see another rise, the lesser timeframe patterns were bearish, especially in the 5-day pattern breakout from Friday and trading below the Weekly 50% levels.

    There wasn't a probability pattern on Monday, it was a day for screen traders using the levels in the 5-day pattern.


    • Daily Trading Set-ups & Analysis
  • Index Futures SPI, DOW S&P, & Forex
  • Subscribe to the Trader Premium
  • http://www.datafeeds.com.au/premiumtrader.html


  • SPI Daily 2nd November 2009 part 2

    "Last week's view was bearish, as price was reversing down from the highs and back into the monthly 50% levels.

    Support in the 5-day pattern @ 4511-19, and above support (42 points)

    Price is following the lower weekly open and 2-day UP move into resistance levels"


    Premium Report


    SPI Weekly and 5-day pattern.

    At this stage there is nothing bearish in the SPI, as last week’s reversal down was a pattern into the monthly 50% levels.

    And whilst price is above the monthly 50% levels then November can continue higher, once price is trading and closing above the Weekly 50% level (Friday).

    Of course things can quickly change if there is weakness in US markets, but they are also above their monthly 50% levels, even though there is a lesser timeframe pattern that might see some weakness on Monday, but I’m not counting on it.