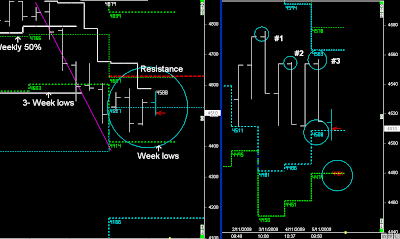
If that occurs today, then that level is @ 4554.
if the SPI hits 4554 and begins to drift back down we will probably have another tight trading day :- support 4508
Should the SPI be trading above 4568, then there is a bias to close higher and continue towards the Weekly 50% level @ 4627"
Premium Report
 SPI Weekly and 5-day pattern
We have a tight Weekly range occurring around the November 50% level, trying to work out which direction the SPI will close on Friday.
The 3-day cycle is bearish @ 4588, that can push prices lower by Friday, resulting in a tight 5-day weekly range around November’s 50% level, or continue down into the Weekly lows @ 4414.
This is based on the break and extend pattern from last week’s lows down into this weeks lows.
At the start of the day I didn’t have a view on the direction other than reacting to the price action around 4554 in early trading and trading to price action down into the lows.
This has been the exact same patterns for the past 3-days, and intra-day has seen the exact same price action.
At this stage the SPI remains in a tight 5-day pattern, whilst US market continue to consolidate in tight 5-day patterns also.
- Daily Trading Set-ups & Analysis


