Index Futures, Forex Reports 18th Oct 08

Weekly Index & Forex Reports out now...

Australian Index (SPI) Futures

http://austindex.blogspot.com/


DOW and S&P Index Futures


http://usindexweekly.blogspot.com/

EUR/USD, AUD/USD. GBP/USD

http://www.forexspread.blogspot.com/

Note: Weekly BHP and Banking Reports Update

http://aussie-stocks.blogspot.com/


  • Daily Trading Set-ups & Analysis
  • Index Futures SPI, DOW S&P, & Forex
  • Subscribe to the Trader Premium
  • http://www.datafeeds.com.au/premiumtrader.html


  • DOW S&P Trading 17th October 08 Recap

    "Looking at price action I have to favour the Weekly 50% level along with a higher Daily open as resistance and a push down, that will depend on the 5-day 50% level.

    No probabilty pattern for Friday:- below 50% level and expectation that price will move down into support"


    Premium Report


    DOW Daily and 5-day pattern

    Higher open and push down from the 5-day 50% level into support.

    And the rest of Friday consolidated between the Weekly 50% level and the 5-day support.


    SPI Trading 17th October 2008 recap

    "Opens below 4241 and price is moving down into random support @ 4133.


    If the market opens below 4241 then I'm leaning to price pushing down (double R44 - 87 points).

    Friday can certainly can continue lower if it's trading below 4133,

    But at this stage I'm not factoring in price spending too much time below 4133"


    Premium Report


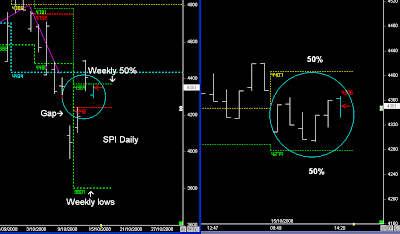
    SPI Daily and 5-day pattern

    Higher open and SPI moves down into 4133, but then just keeps going down...

    Dragged down by resource stocks and SPI follows the 5-day pattern lower


    • Daily Trading Set-ups & Analysis

  • Index Futures SPI, DOW S&P, & Forex

  • Subscribe to the Trader Premium

  • http://www.datafeeds.com.au/premiumtrader.html


  • S&P (e-mini) DOW 16th October 08 recap

    "Probability pattern on the break of support from the previous day is:-

    Re-test the 50% level early and continue down into Thursday's support"


    Premium Report


    DOW and e-mini 5-day pattern

    US markets rose up into the 50% levels on Thursday and sold down, with the DOW moving down about 500 points.

    I would have preferred (obviously) to have seen Thursday continue down into support and then bounced...as I will explain in the Premium report for Friday.

    The good thing in the short-term is, price is back above the 50% level.


    SPI Trading 16th October 2008 recap

    "Lower open and trading range is between 4133 and the 5-day lows.

    Patterns we need to keep an eye on today are:- Lower open and price normally looks to move UP towards the Spiral filter :- double R44.

    If that's the case:- around double R44 points up and trading longs early in the day is open to risk, as price could reverse down and move towards the 5-day lows"


    Premium Report


    SPI Daily and 5-day pattern

    Thursday played out precisely on the way up:- moving double R44 upwards and then reversing back down.

    It didn't move all the way down into the 5-day lows, but it can certainly open down there tomorrow if US markets continue down on Thursday.

    October low resistance and Weekly 50% level rejection this week can see the SPI down around 3801-28 tomorrow


    • Daily Trading Set-ups & Analysis
  • Index Futures SPI, DOW S&P, & Forex
  • Subscribe to the Trader Premium
  • http://www.datafeeds.com.au/premiumtrader.html


  • S&P (e-mini) DOW 15th Ocotber 08 recap

    "Lower Weekly open and we have a Weekly 50% level HOOK and TEST pattern.

    This favours a continuation upwards, or a bias to rise higher into Friday.

    Monday HOOK, and TUESDAY test and support....

    Support as shown:- High risk trading longs below support"


    Premium Report


    S&P Daily and 5-day pattern

    This is how well we can tell if US markets are going to continue higher
    this week or not.

    Lower Weekly open on Monday has a 'HOOK' pattern over the Weekly
    50% level @ 992.

    Tuesday's higher open and expectation that price will pullback into
    support.

    Support was verified on Tuesday.

    Whenever there is a HOOK & TEST pattern in a 'bull' market price will
    normally continue upwards into Friday:- higher Weekly close.

    It obvious that this is a bear market, but it's still the same pattern.

    Higher timeframe:- and is still below the October lows, therefore the 5-day highs are still view as resistance.

    Breaks support and......

    Markets move back down towards their 5-day lows once again.


    SPI Daily 15th October 2008 recap

    "SPI Trading below the October lows, so at this stage it's viewed as resistance based on a Monthly breakout.

    Today:- Looks range bound between the 50% levels:- support the 5-day 50% levels 4279.

    Ideally I would like to see 4279 hold support today, and if that is the case, look for any late buying after 2.50pm that could push the SPI back towards 4407.

    At this stage I haven't factored in weakness below the 5-day 50% level @ 4279"


    Premium Report


    SPI Daily and 5-day pattern

    Wednesday remained range bound between the 50% levels

    SPI pushed down early in the day moving double r44 range, and with late BUYing pushing the SPI up into the close.

    Trading day didn't get down into the support level that I wanted, and the UP move didn't travel as far as I hoped (4407)


    • Daily Trading Set-ups & Analysis
  • Index Futures SPI, DOW S&P, & Forex
  • Subscribe to the Trader Premium
  • http://www.datafeeds.com.au/premiumtrader.html


  • S&P (e-mini) DOW 14th Ocotber 08 recap

    "October low breakout, therefore the breakout lows are viewed as resistance.

    It's the same pattern that has occured on the SPI today:- breakout of Monthly lows and price can remain outside the range until the end of the month.

    S&P 5-day :- If that's the case, then the 5-day highs are viewed as resistance and a rotation back down into Support:- 50% level"


    Premium Report


    S&P Weekly and 5-day pattern

    US markets:- October lows resistance and Tuesday rotated back down into support....


    SPI Trading 14th October 08 recap

    "SPI is trading around the October lows @ 4465.

    Whenever there is a breakout of the Monthly lows, price can remain outside this level for the entire month and then continue lower in the new Month (November)

    But if it's inside the October lows, then the bias is to move towards the 50% level, stall, and that's going to depend on a number of factors....

    If financials and resources stocks have bounced off their 4th Quarter lows, often there is a bias to continue towards the 3-week highs.If that's the case, then the 3-week highs in the Aussie market is trading around the October 50% level.

    SPI 5-day pattern Today:- major gap open @ 4500

    And trading around the previous bottom @ 4536 in the 3rd Quarter, which can become a resistance with an expectation that price will move back towards the 5-day 50% levels"


    Premium Report


    SPI Weekly and 5-day pattern

    SPI Trading below October lows, and today's higher open resulted in a move back towards the 5-day 50% levels.


    • Daily Trading Set-ups & Analysis

  • Index Futures SPI, DOW S&P, & Forex

  • Subscribe to the Trader Premium

  • http://www.datafeeds.com.au/premiumtrader.html


  • S&P (e-mini) DOW 13th Ocotber 08 recap

    "Ideal pattern would be a 5-day 50% level push down into support, and then a higher move off support into ther close.

    Don't short-trade above the 50% level."


    Premium Report

    S&P Weekly and 5-day pattern

    S&P and US markets have followed the same pattern, rising up from a new lower weekly open and moving back towards the October lows.

    The ideal pattern on Monday didn't play out precisely, as prices didn't come down into support.

    The interesting part on Tuesday is, how do prices react to the October lows?

    Because a breakout of a timeframe often will remain outside that level until the next timeframe begins :- November


    SPI 13th October 2008 Recap


    SPI Daily and 5-day pattern

    Early resistance around the 50% level @ 4240...

    But as pointed out in the Weekly report...

    Banks and Energy stocks hit major support levels last Friday, so the bias is to move back towards the higher 50% levels around 4352+.

    That will depend on US markets on Monday.

    • Daily Trading Set-ups & Analysis
  • Index Futures SPI, DOW S&P, & Forex
  • Subscribe to the Trader Premium
  • http://www.datafeeds.com.au/premiumtrader.html


  •