Index Futures, Forex Reports 31st Jan 09

Weekly Index & Forex Reports out now...

Australian Index (SPI) Futures

http://austindex.blogspot.com/


DOW and S&P Index Futures


http://usindexweekly.blogspot.com/

EUR/USD, AUD/USD. GBP/USD

http://www.forexspread.blogspot.com/

Note: Weekly BHP and Banking Reports Update

http://aussie-stocks.blogspot.com/


S&P (e-mini) 30th January 09 recap

"Expectation Markets are heading down in February

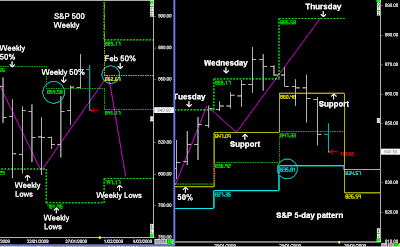
US markets can do two things:- continue down on Friday

Or.....

Follow the pattern rising upwards into a higher Friday close. This will align with the February 50% level next week and a higher Weekly open, which should push the market back down into new lows.

Thursday broke support, therefore there is an expectation of a move down into lower support:- 2-day pattern

If Friday is going to close higher then price should bounce off support and continue upwards.

Bearish pattern would be a failure at the Weekly 50% level and price trading below support:- breakout"


Premium Report


S&P Weekly and 5-day pattern

US markets continued down into Friday's support, found some buyers early...

But couldn't sustain the strength, which is part of the push down into February's lows.


SPI Daily 30th January 2009 recap

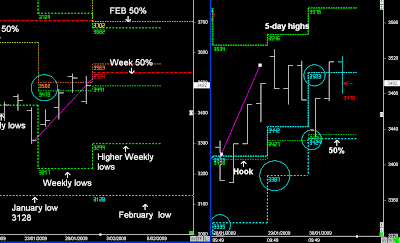
"SPI is simply going to be defined by the 5-day 50% level:- 3429-34

Below and it’s part of the Weekly trend downwards ;- 3887 & 3335


Above 3429-34 part of the Higher Friday close:- towards 3503 after 3pm..."


Premium Trader


SPI Weekly and 5-day pattern

SPI opened lower on Support and continued higher into 3503, as part of the higher Weekly close.

There is now an expectation that markets can unwind and continue down towards the February lows.

Even though the SPI isn't near the February 50% level, which would provide the most robust reversal down, the Weekly 50% level can easily do the same thing early next week.

That will also depend on US markets on Friday, and the direction they take.

Do US markets follow the same pattern and close higher on Friday, as part of the higher weekly close....

or do they break support and continue down on Friday....

Weekly Report tomorrow


S&P (e-mini) 29th January 09 recap

"Whilst markets are above the Weekly 50% level, the expectation is to continue higher into Friday...

If US markets are going to continue higher on Thursday, then prices should remain above the Yellow support and continue towards Thursday's highs.

Below Support and expectation US markets are moving back down, as shown in the S&P.

This would normally result in a 2-day pullback"


Premium Report


S&P Weekly and 5-day pattern

I wasn't factoring in a Down day on Thursday because of the price action over the previous 3 days, but once Support couldn't hold the same pattern of a 2-day pullback is taking place.

This week's view was for a higher Friday close (random length), but then look for next week to continue the trend down towards February's lows.

It looks like the reversal pattern downward has begun with Thursday's break.


  • Daily Trading Set-ups & Analysis

  • Index Futures SPI, DOW S&P, & Forex

  • Subscribe to the Trader Premium

  • http://www.datafeeds.com.au/premiumtrader.html


  • SPI Daily 29th January 2009 recap

    SPI is opening above the Weekly 50% levels and there is a bias for the market to close higher by Friday:- random length.

    SPI is opening around the 5-day highs 3534-46.

    Depends on where the market opens today, as price could sell off on open from 3534, or actually push upwards 22-27 points and then reverse down.

    Therefore the expectation is for these levels to be resistance, but I'm not expecting too much downside:- a simple 44 points would be nice into 3490.


    Premium Report


    SPI Weekly and 5-day pattern

    SPI opened higher and moved back down into the Weekly 50% level.

    The SPI didn't open high enough to get into shorts, and price didn't move up 22 points to get into a inverted trade to trade the down move today.

    The Weekly 50% level @ 3473 supported the market all day, but the UP move back towards the highs didn't occur until after the market had closed.

    All the upside action occured in the last 20 minutes.

    Price action so far still favours higher prices by Friday.


    • Daily Trading Set-ups & Analysis
  • Index Futures SPI, DOW S&P, & Forex
  • Subscribe to the Trader Premium
  • http://www.datafeeds.com.au/premiumtrader.html


  • S&P (e-mini) 28th January 09 recap

    S&P has closed right on the 50% level:- 'HOOK' pattern and a continuation upwards.

    We can also see the higher Weekly lows in the forward Weekly timeframe...Whenever there are higher or lower timeframe channels in the forward timeframes (Dilernia Drops), the bias is for the trend to continue in the same direction into Friday.

    This can result in a supported day with another late UP move towards Wednesday's highs and a higher daily close in the last hour of trading if price is above Wednesday's highs.:- breakout.

    If price is supported on the Yellow and rising higher into the close, US markets might not come back down for the rest of this week, as they chase higher prices into Friday"


    Premium Report


    S&P Weekly and 5-day pattern

    The Ideal set-up on Wednesday was for the S&P to come back down into support and then trade upwards into Wednesday and continue with the breakout, and then higher prices by Friday.

    Sadly this didn't occur, and the S&P continued higher from the HOOK pattern on the Weekly 50% level.

    The bias is now to continue towards Friday, which has a random length, but normally the view is for the market to continue towards the 3-week highs.

    SPI Daily 28th January 2008 recap

    "SET-UP A:- 4th week reversal back into February's balance point
    and then continues down into the lows from next week, as per Weekly
    Report.

    This often occurs when the market has moved 3 weeks in one direction,
    the following week can often close in the opposite direction:- higher Weekly close.

    SET-UP B:- There is a 3-week low breakout from last week @
    3426, price has come up and is now retesting the break.

    This often leads with a higher daily open and a continuation of the
    down move as of TODAY, and makes it's way down towards the Weekly
    lows later this week.

    Wednesday:- 2 plays simply based on 3409

    Trading below 3409 and bias is to continue down towards the lower
    channels @ 3335, as part of Set-up B.

    Above 3409 level results in a 'HOOK' pattern.

    3409 becomes support and moves upwards 44 points:-continuing towards
    the Weekly 50% levels"


    Premium Report


    SPI Weekly and 5-day pattern


    Today started with the higher open selling off from 3426 moving down into
    44-point lows. Whilst price was below 3409 the expectation was a continuation down into 3335.

    Except the market reversed off its 44 point lows and HOOKed back above 3409.

    I was looking for a retest of 3409 for a move towards the highs, except
    the HOOK pattern didn't pan out. That pattern would have provided
    the perfect long set-up:- text book pattern.

    But once price started to trade above 3426 (previous Weekly lows),
    these levels became support :- confirmed with intra-day spiral lows rising
    upwards into the Weekly 50% level.

    We can also see the higher Weekly lows in the forward Weekly timeframe, this goes back to my view of this week rising upwards after 3 weeks of down trends.

    Whenever there are higher or lower timeframe channels in the forward timeframes (Dilernia Drops), the bias is for the trend to continue in the same direction
    into Friday.

    However, any continuation upwards this week has to be helped by the US markets following the same pattern.

    Because at this stage price has simply moved back into the Weekly 50% levels, which often occurs at the start of the new Weekly timeframe.

    S&P (e-mini) 27th January 09 recap

    "US markets rotating back into the Weekly 50% levels:- resistance

    The 4th Week after 3 weeks down often can continue upwards, as it rotates back towards the February 50% levels....

    But looking at the 5-day pattern:- I would treat the 5-day 50% level as support, which could result in a higher Daily close"


    Premium Report


    S&P Weekly and 5-day pattern

    I was looking for an UP day on Tuesday, but the S&P didn't reach the ideal support zone.

    I was also expecting a move to test Tuesday's highs which matched the Weekly 50% level, instead Tuesday ended up quiet flat.

    There is still a posibility that this Week can continue higher, but at this stage I'm treating US markets as simply rotating back into the Weekly 50% level in the first 2 days, and could come under pressure at the end of this week if it breaks the support on Wednesday.

    SPI Daily 27th January 2009 recap

    "We have had 3 weeks of movement down in January, and often there is a possibility that the 4th moves in the opposite direction, as per Weekly report.

    We have seen this with US markets and currencies, all moving back towards their Weekly 50% levels on Monday.


    Therefore there is a possibility that the SPI is going to follow a similar pattern, and if this is the case a move back towards the 5-day 50% level @ 3405-8 could occur"


    Premium Trader


    SPI Weekly and 5-day pattern


    SPI moves back towards 3405-8, as it rotates back towards the 50% levels.

    Today's trading was simply trading on the side of 3367....

    Below it was down into 3303.

    Above 3367 and it became a robust support zone, and price moved up into the upper channels.


    S&P (e-mini) 26th January 09 recap

    "As per the Weekly report, there is a possibility of a higher Weekly close after 3 weeks down

    No probability pattern on Monday, other than using the levels in the 5-day pattern"


    Premium Report


    S&P Weekly and 5-day pattern

    S&P rising up from support on Monday & moving back towards the Weekly 50% level at the start the new week.

    I didn't have a probability pattern for Monday's, other than using the levels in the 5-day pattern, but I was surprised by the strength shown in the S&P.

    Monday's highs formed resistance, resulting in sellers appearing around the highs.

    The Weekly 50% level is still the trend guide for the last week of January.