Index, Forex, Stocks 12th Feb 2011 Weekly

Weekly Index & Forex Reports out now...

Australian Index (SPI) Futures

http://austindex.blogspot.com/


DOW and S&P Index Futures


http://usindexweekly.blogspot.com/

US Dollar INDEX, AUD/USD, EUR/USD

http://www.forexspread.blogspot.com/

OIL Futures:- OIL BOIL

http://www.oilboil.blogspot.com/


Note: Weekly BHP, RIO,  TLS, BTA Banking Report Update


S&P (e-mini ) 11th February 2011 Daily recap.

Either side of 1316 and the trend bias is for Friday to move towards the extreme.

Above 1316 an expectation the S&P is moving towards 1331
.


S&P Weekly and daily range.

During globex hours the market was trading below 1316, therefore there was the bias for Friday to move back towards 1304 and the weekly level.

However, the channel lows @ 1310.75 provided support and the springboard for Friday to continue to trend up towards the February highs @ 1331, as described in last week’s report.


SPI Daily 11th February 2011 recap

The SPI is back into the resistance levels @ 4883

if below the expectation is down into the daily 50% level @ 4861... (and possibly lower)


SPI Monthly and Daily

As noted in last Week's Report (Weekly)... around the February highs would hit resistance...

And the Quarterly highs @ 4883 would try and push the market back down.

My expectation that yesterday would try and move down, but today presented the exact same set-up.... use the higher timeframe levels as resistance @ 4881/83 

The February highs completes the 2-month wave pattern within the current Quarterly cycle

Personally, I wouldn't want to buy into the market at these levels. I would want to see the market move back down into trailing support levels.

However, as noted in last week's report...

There is a Primary cycle that is trying to send to market up towards 5093 by the 2nd Quarter.


S&P (e-mini ) 10th February 2011 Daily recap.

Resistance:- Thursdays highs & 1331.50


S&P Weekly and Daily range…

After Wednesday’s price action, my view was that Thursday would try and push up towards the highs…

Instead the market remained choppy around the Weekly highs, and within the daily channel range of 8.5 points


SPI Daily 10th February 2011 recap

SPI is now trading between two higher timeframe levels, one is acting as resistance @ 4881/3 and the other is acting as support @ 4849

My view is that the market will try and move back down into support (4846/49)


SPI Weekly and 5-day pattern.

Based on resistance levels in the higher timeframes and also the brown filter @ 4886, the bias was to short trade and run stops above 4886…

Simply because there were no long set-ups on open unless the market came back down into the support level @ 4846/49.

Any further gains towards Thursday's highs will depend on whether the S&P 500 continues up towards 1331 overnight.


S&P (e-mini ) 9th February 2011 Daily recap.

my view is that price will move down from Tuesday’s highs and back towards the trailing support levels (day 50% levels and blue channel highs)- (minimum move 8.5 points).

Random support @ 1311


S&P Weekly and Daily range.

As per Monday’s report…. based on the Daily close above the 5-day highs on Monday, price can continue to push up towards Tuesday's highs…if that's the case, then Tuesday's highs are seen as resistance, with a reversal pattern towards the 5-day 50% level

That price action has played out on Wednesday…

And based on the current price patterns, my view is that the market will probably try and push upwards once again…. (1331)....

As long as it remains above 1316.


SPI Daily 9th February 2011 recap


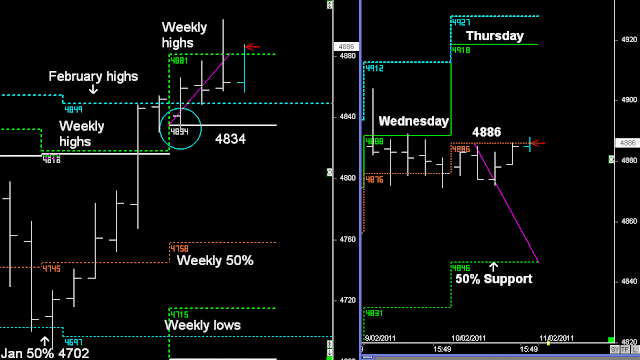
SPI completes the break and extend pattern from last week's highs into this week's highs, which also coincides with the Quarterly level @ 4883

Next Spiral filter will form 21 points up from open @ 4903.

Below 4876 and looking for a move towards the daily 50% level @ 4831


SPI Weekly and Daily range.

The SPI has completed the move into higher timeframe resistance levels, after the 21 point rise in early trading forming the next spiral filter.

And then Wednesday’s highs formed resistance @ 4888, pushing the market into a lower daily close...

however, it didn’t continue down into the daily 50% level @ 4831….

Therefore any further weakness will depend on the overnight price action in the S&P 500.

If it does continue down, then the trend guide for the rest of this week will depend on the Weekly level @ 4834.

Note:- above 4883/88 and the Primary cycle trend is continuing towards 5093, as per Weekly report.


S&P (e-mini ) 8th February 2011 Daily recap.

S&P Resistance @ 1316, as per Weekly report.

However, based on the Daily close above Monday’s highs, the trend can continue to push up towards Tuesday’s highs.


S&P Weekly and daily range.

As per Weekly report, there are two possible patterns playing out…

#1) 1316 forms resistance and continues down

#2) or trend is continuing up towards 1331.

Based on Monday’s close above 1312.50, the S&P has followed the break and extend pattern upwards, following the daily range towards Tuesday's highs.


SPI Daily 8th February 2011 recap

there is enough reason for the SPI to hit 4871 and reverse down:- completion of the break and extend pattern from Friday.

Next Spiral filter forms at 4849, which matches the February highs, and is the trend guide for today.


SPI Weekly and Daily range.

Early resistance around Tuesday’s highs @ 4871,  and a 21 point reversal down into 4849 forming the next spiral filter.

There were two patterns at play around 4849….

#1 if below it's moving down another 42 points from 4849. Also February highs

#2 if above it's trending up towards the highs @ 4893+


The market followed #2, and whether the SPI continues up towards 4893 during sycom will depend on the S&P 500 and it’s February highs @ 1316.


S&P (e-mini ) 7th February 2011 Daily recap.

"Weekly highs match the monthly highs @ 1316 :- resistance."

                                                 S&P 500 Weekly and Daily range.

Monday has pushed upwards and it’s hit resistance @ 1316 and stalled (Weekly and Monthly highs


The rest of this week has two possible patterns that’s going to play out…


#1. 1316 resists the trend from moving upwards, and reverses back down. If below 1304, then I'd be looking for further weakness this week, as it completes the double monthly high in February

#2 1304 pushes the S&P 500 upwards, and the trend continues to move towards 1331 during the current month of February, as illustrate in the Weekly report.

At this stage I’m treating the market as hitting resistance, but there hasn’t been follow through just yet to help validate #1, using 1304 as the trend guide.

And whilst the market remains above Monday's highs @ 1312, there is always the possibility that Tuesday moves upwards once again.


SPI Daily 7th February 2011 recap

As per Weekly report, there is an expectation that the trend is following the Weekly range towards 4881, which matches the Quarterly highs @ 4883

However, if below 4852 the expectation the market is moving back down

4834 random support.


SPI Weekly and Daily range.

 
There are two patterns at play, as per Weekly report….

#1 the market continues upwards (4881/83)

Or

#2 the market has completed the double monthly high in February @ 4849 and begins to rotate back down.

The latter won’t happen unless the S&P 500 reverses down from it’s own February highs.

Therefore 4834 and the Weekly level was seen as a random support zone, and not a higher probability BUY zone today.