Index, Forex & Stocks 20th November 2010 Weekly

Weekly Index & Forex Reports out now...

Australian Index (SPI) Futures

http://austindex.blogspot.com/


DOW and S&P Index Futures


http://usindexweekly.blogspot.com/

US Dollar INDEX, AUD/USD, EUR/USD, GBP/USD

http://www.forexspread.blogspot.com/

OIL Futures:- OIL BOIL

http://www.oilboil.blogspot.com/


Note: Weekly BHP, RIO, TLS, and Banking Report Update


S&P (e-mini ) 19 November 2010 Recap

No probability on Friday’s direction.

Use the levels in the Daily range


S&P Weekly and Daily range

Market remains choppy either side of  the daily levels


SPI Daily 19th November 2010 recap

The market is currently trading below the Weekly 50% level, so there is a possibility that Friday closes lower.

Trend guide 4670


resistance 4687-96 (24 hour levels)


                                                           SPI Weekly and Daily range.

Early rise upwards from 4671, which closed the Gap to Tuesday’s lows @ 4688, and also hitting resistance levels in the 24 hour range.

Once the market reversed and closed below 4671 the trend bias was to move back down towards a lower Friday close.

Market is currently being supported around the Weekly level @ 4631…

With the expectation that price is trying to move lower towards 4571-82

Weekly report out tomorrow.


S&P (e-mini ) 18 November 2010 Recap

There are two possible patterns for Thursday…

#1. Daily 50% level sends the market back down into the Daily and Weekly lows


# 2 Market remains within the Weekly levels, and continues back towards the daily highs


S&P Weekly and Daily range.

My initial view was for the market to continue down using the Daily 50% level as resistance

However, when the market was still trading above 1184.74 and closing above the 50% level when the cash market opened, the trend bias was for Thursday to swing back towards the highs….

And most likely continue higher on Friday.


SPI Daily 18th November 2010 recap

Resistance 4658

Support 4631-4633

We have a lower daily open and if the market is above 4633 then there is an expectation that price is moving back towards 4658:- resistance.


                                                              SPI Weekly and daily range.

Lower daily open and consolidation above support levels @ 4631-33…..

And then a late rise up towards 4658.

Depending on the price action in US markets….

There is the gap fill from Tuesday @ 4688 that needs to be filled…

Otherwise the SPI will open lower tomorrow, if US markets continue with the trend and move lower overnight.


S&P (e-mini ) 17 November 2010 Recap

break out of the daily lows on Tuesday, should continue down into Wednesday's lows.

Resistance 1183.50 - 1186.75


                                                S&P Weekly and Daily range

Small range day without reaching the resistance zones or the support zones around the Weekly and Daily lows @ 1167.

Wednesday has ended up small inside day, but those same levels will be used as resistance on Thursday.


SPI Daily 17th November 2010 recap

Trend guide @ 4655.

Either the market swings back towards 4682

Or it will remain flat between 4631-36


SPI Weekly and Daily range.

SPI Remained flat with a push down into the spiral filter @ 4636 in early trading and then a rotation back into 4655, which then formed resistance.

At this stage the trend bias is to continue down ,as described below…
SPI Monthly and Weekly


SPI coming down into support levels once again @ 4571-82.

If the market is going to go higher then these levels need to be verified by this week's Friday close (or the next) and then continue higher in December.

this usually occurs in the last week of the current month and then pushes upwards in the first week of December from the monthly 50% levels into a higher weekly close.

What we also notice is that December has a higher step formation.

This can often end up a bearish pattern (please read current book regarding bearish patterns)


S&P (e-mini ) 16 November 2010 Recap

Market is coming down from the November highs and trading below the Weekly 50% level.

Tuesday is either going to find random support around 1183…

Or it’s going to breakout as part of the larger reversal pattern towards the November 50% level @ 1161


                                               S&P Weekly and Daily range.

Monday’s daily close below the weekly 50% level help set-up further weakness with a breakout of the daily lows on Tuesday…

as the market rotates down from the November highs towards the Weekly lows and the November 50% level @ 1161


SPI Daily 16th November 2010 recap

Trend guide:- 4704

Either price is going to push down into Tuesday’s lows @ 4683 or swing back towards 4735.


SPI Weekly and daily range.

Another choppy trading day either side of 4704…

It wasn’t until the market moved down into 4690 providing a lower spiral filter that the market moved upwards into a higher daily close.


S&P (e-mini ) 15 November 2010 Recap

Trend guide 1197.75 and the Weekly 50% level.

Either the market follows a 2-day swing back towards 1214…

Or follows a move down into Monday's lows and 1183


                                                         S&P Weekly and daily range.

By the time the cash market opened the S&P was trading above 1197...

 rising precisely 8.5 points and intra-day high on Monday

But then it struggled to remain above the daily 50% level moving back down into the Weekly 50% level.


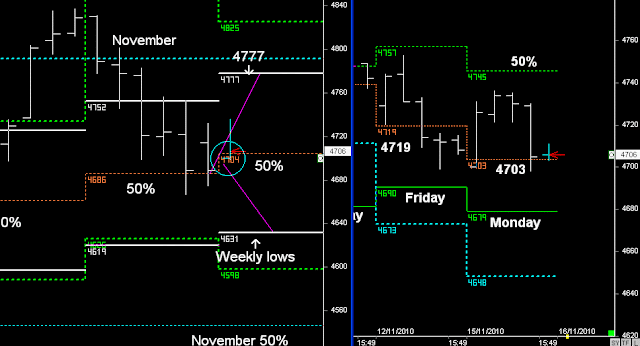
SPI Daily 15th November 2010 recap

Trend guide 4704 (Weekly 50% level).

This week’s guide @ 4704 is whether the market swing back towards 4777 or continues down into the Weekly lows.

Today :- above 4703 and target is 42 points


                                                                   SPI Weekly and daily range.

Early rise upwards with a target high of 42 points @ 4741 failed to reach (high 4736)

The rest of today remained in a tight trading range around the key support levels of 4703-04 on Monday