Index Futures & Stock Reports 15 AUG 09

iWeekly Index & Forex Reports out now...

Australian Index (SPI) Futures

http://austindex.blogspot.com/


DOW and S&P Index Futures


http://usindexweekly.blogspot.com/

EUR/USD, AUD/USD

http://www.forexspread.blogspot.com/


OIL Futures:- OIL BOIL

http://www.oilboil.blogspot.com/


Note: Weekly BHP, RIO, and Banking Report Update

http://aussie-stocks.blogspot.com/


SPI Daily 14th August 2009 recap

SPI futures and 5-day pattern

SPI Completes the 3rd Quarter move into the Yearly 50% level @ 4455

That was my entire 3rd Quarter UP move play, which occurred much quicker than I wanted it to.

My preferred play was the reversal down from August highs @ 4313 and trade longs once again off support into these highs based on the 2 month higher high pattern.

This now completes the 3rd quarter move, and I won’t have a view until this month ends or even the next quarter begins.

Yesterday continued up from the 5-day breakout and the extend upwards into Friday's highs & spiral top.

Spiral top high and price completes the range towards 4404 random support (spiral filter 44, and now below 4455 (Yearly 50% level)

My view that whilst below 4455 it's trying to move back to retest yesterday's breakout.

And because price has stalled below Friday's highs, I would look for a 2-day reversal pattern early next week

However, that will depend on the price action in US markets, and by the look of Friday's set-up I can't see too much downside.


DOW Futures 13th August 2009 recap

August highs resistance, but just like what occured in the Australian Market there is a possibility that over the next 2-days price continues towards the upper August highs @ 9506

Two plays on Thursday....

A continuation upwards into the 5-day highs and a reversal back down into the 5-day 50% level.


Thursday's 5-day 50% level will be the trend guide on any further rises or consolidation


Premium Report


DOW Futures and 5-day pattern

US markets continue higher this week along with some nice intra-day patterns occuring on Thursday.

The 5-day high reversal pattern into support, and support pushing the market in a higher higher Daily close, and probably continue towards 9506 on Friday.

  • Daily Trading Set-ups & Analysis
  • Index Futures SPI, DOW S&P, & Forex
  • Subscribe to the Trader Premium
  • http://www.datafeeds.com.au/premiumtrader.html


  • SPI Daily 13th August 2009 recap

    "SPI opening above the August highs @ 4313 and also above the 5-day highs from Wednesday.

    Just by looking at the 5-day pattern I would have to favour a move up into Thursday's highs @ 4379 and more than likely complete the move into 4400 by Friday.

    Support and trend guide 4329"


    SPI Weekly and 5-day pattern

    SPI continued with the 5-day pattern into 4279 and then reached 4400 today with another breakout pattern.

    There is still a weekly close to determine how far the UP move will continue
    in the short-term

    If there is a lower Weekly open below 4313 because US markets
    can't breakout of their August highs, then there is a potential to rotate back
    down based on the US markets 5-day pattern below August highs, as described in the previous post.

    If US markets continue to follow a higher friday close, then it's obvious
    the SPI is going to continue up.

    This UP move in the 3rd Quarter has completed my view and target, without the short-term pullback that I wanted.


    S&P (e-mini ) 12th August 09 recap

    US markets moved down into the Tuesday's lows and should continue down into Wednesday's 5-day lows...

    There are 2 patterns at play on Wednesday...

    1. price sells down into the 5-day lows & break as part of the August high reversal pattern.

    2. Wednesday's 5-day lows find support and swing back up into a higher daily close


    Premium Report


    S&P Weekly and 5-day pattern

    Early move down into the 5-day lows and a reversal and higher Daily close.

    That down move and reversal upwards was part of a 2-day pattern play but I must admit I was surprise by the extent of the reversal upwards.

    August highs continue to resist price from rising...

    The rest of this week is either going to continue to consolidate in a tight 5-day pattern and the next two days remain range bound.

    If this happens then I'm looking for next week to sell down into the Weekly 50% level.

    So far, this week has see a higher Weekly open and a 2-day reversal down into the 5-day lows.

    A 3rd Day UP move from the 5-day lows and back above the 5-day 50% level.

    If this pattern was occuring anywhere else I would favour Thursday and Friday to continue higher, and that's still a possibility.

    However, because of the August high resistance levels it makes that higher weekly close all that harder.

    Thursday's 5-day 50% level will be the trend guide on any further rises or consolidation


    • Daily Trading Set-ups & Analysis
  • Index Futures SPI, DOW S&P, & Forex
  • Subscribe to the Trader Premium
  • http://www.datafeeds.com.au/premiumtrader.html


  • SPI Daily 12th August 2009 recap

    August highs resistance with the expectation price is moving down....

    today's trend guide is 4276.

    I favour a move down and price to continue down in the 5-day lows, same pattern as US markets.

    If the SPI is going to continue to play 'silly' games and hug the August highs, then the R42 low and Spiral filter could see a move upwards again.


    Premium Report


    SPI Weekly and 5-day pattern

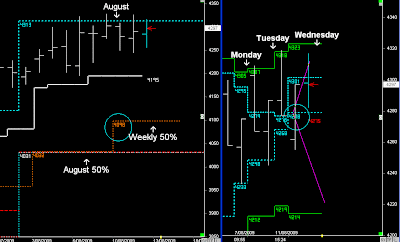
    SPI continues to 'hug' the August highs and not continue down into the Weekly 50% level.


    There was a robust pattern around 4276 to sell off, as it was below dynamic support levels but price continued up into 4313 once again and stalled.

    I haven't changed my view that the SPI will move lower, and if it continue over the next 5 days like this and remain in a very tight 5-day pattern, then I'll look for next week to move down into the 50% levels.


    S&P (e-mini ) 11th August 09 recap


    S&P Weekly and 5-day pattern

    August highs resistance and a move down into the 5-day lows...

    Expectation that price will continue to zig-zag it's way towards the Weekly 50% level over the next 2 weeks


    • Daily Trading Set-ups & Analysis
  • Index Futures SPI, DOW S&P, & Forex
  • Subscribe to the Trader Premium
  • http://www.datafeeds.com.au/premiumtrader.html


  • SPI Daily 11th August 2009 recap

    "Expectation of a reversal down from the August highs @ 4313.

    A higher Weekly open and a break support from yesterday @ 4273 should continue down towards the 5-day lows

    4253 is the trend guide


    Premium Report


    SPI monthly and 5-day pattern

    Early sell down on open but price couldn't remain below 4253, instead late buying has pushed the SPI back into the monthly highs and Tuesday's highs.

    After a higher Weekly open and yesterday's sell pattern from the 5-day highs I was expecting more weakness.

    All previous reversals in April, MAY, and June began from monthly high resistance, a higher weekly open and all reversed down from the 5-day highs.

    Even the start of July started from a higher Weekly open and the 5-day high, pushing the first week downward before the price rally and 3rd Quarter UP move.

    This week was no different & Monday highs @ 4307 set-up the move for a continuation down towards the 5-day lows, as part of a monthly reversal before the trend continued higher in the 3rd quarter.

    Instead price bounced off the channel lows @ 4251 and once the R42 closed back above 4279, the bias was to follow the 5-day pattern into the highs once again @ 4318.

    Depending on US markets:- Yearly target could be reached this week, which is a bummer.


    • Daily Trading Set-ups & Analysis

  • Index Futures SPI, DOW S&P, & Forex

  • Subscribe to the Trader Premium

  • http://www.datafeeds.com.au/premiumtrader.html


  • S&P (e-mini ) 10th August 09 recap

    S&P 500 is beginning the trading week with a higher Weekly open and trading below the August highs.

    I have only 1 view of the market, and that’s a pullback towards the Weekly 50% levels over the next 2 weeks.


    Premium Report


    S&P Weekly and 5-day pattern

    Choppy trading day on Monday & small range day.

    I expected more weakness on Monday or at least a lower daily close below the 5-day 50% level.

    At this stage My view hasn't changed, but it looks like US markets could consolidate until the FED meets later this week.


    • Daily Trading Set-ups & Analysis
  • Index Futures SPI, DOW S&P, & Forex
  • Subscribe to the Trader Premium
  • http://www.datafeeds.com.au/premiumtrader.html


  • SPI Daily 10th August 2009 recap

    "We are starting the trading week with a higher Weekly open and below the August highs(resistance), with the expectation price is rotating down towards the Weekly 50% level...

    The beginning of the down move will be when price is trading below the 5-day 50%

    Resistance 4307 (Monday's highs)"


    Premium Report


    SPI Weekly and 5-day pattern

    All previous reversals in April, MAY, and June began from monthly high resistance, a higher weekly open and all reversed down from the 5-day highs.

    Even the start of July started from a higher Weekly open and the 5-day high, pushing the first week downward before the price rally and 3rd Quarter UP move.


    Today was no different


    5-day highs on Monday 4307 and a range rotation down into the 5-day 50% level

    Now that is is needed is US markets to follow the same patterns on Monday and reverse down from their August highs.