towards their 3-week highs this week.
These 3-week highs are often major resistance zones in any trend, and
there is a possibility that prices can stall and continue with the trend. (DOWN)
Today is simply trading on the side of the 5-day highs @ 3734
Below and it's closing the gap of Monday and probably moving down 87 points"
Premium Report
 SPI Monthly and Weekly (24 hours)
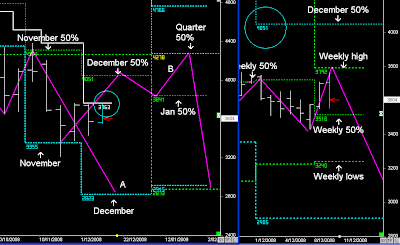
As we can see, the SPI hit the 3-week highs overnight and the market was driven down by sellers hitting the Financials.
Sellers also hit the Weekly highs in the US markets late on Monday.
These 3-week highs are robust resistance zones and price can easily continue down towards December's lows, as it follows the double Monthly low pattern:- SET UP A.
SET UP B:- is what I think will happen
The SPI to consolidate below the 3-week highs until it gets closer to Friday, and if Price is trading around the Weekly highs (not below the Weekly 50% ) there is a possibility of a breakout (Friday close) and then beginning of the move towards December 50% level @ 4051.
Expectation that December 50% level will stall the market, but then continue higher in January.
This higher move in January will rotate back to the new 1st Quarter 50% level in 2009.
This also matches the breakout of the 2008 lows :- retest the break.
Two important patterns in SET-UP B are :- the retest of the Primary breakout in 2008 (Yearly), but also the alignment of the 'Thrust pattern' in the secondary timeframe (Quarterly) , resulting in a new down trend in 2009.
- Daily Trading Set-ups & Analysis


