SPI Daily 8th January 2009 recap

"Trend guide 3706

often price can move down 27 points before reversing upwards.

I'm not expecting too much movement today other than another consolidating trading day.

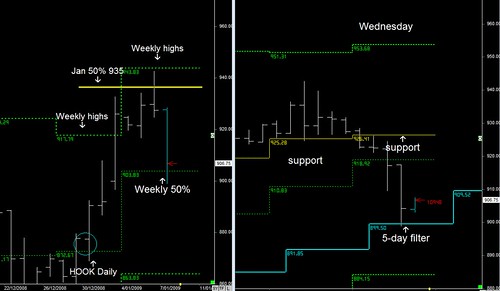
Weekly 50% level is still the trend guide for this week"


Premium Report


SPI Weekly and 5-day pattern

SPI pushed down on open 27 points and remained below 3706 for the entire day resulting in a consolidated trading day.

It remained below the Weekly 50% level @ 3681 for most of the trading day until the market closed, and then the futures market pushed the closing price back above the Weekly 50% level at the end of the trading day.

Two important patterns on price action in the US and on the SPI....

Firstly the reversal down from the January 50% levels on Tuesday (read S&P report below), and it has been the first time in nearly 5 weeks that there hasn't been a reversal back towards the 5-day 50% level during the trading day on the SPI.

And I can't see too much upside in US markets on Thursday......


S&P 500 Daily 7th January 2009 recap

"US markets are trading in a tight band that is being 'capped' below the January 50% levels, and with Tuesday's reversal down from the monthly 50% level, there is now a possibility that prices could begin to drift back down into the Weekly 50% levels.

There can't be a reversal down unless price is trading below support (yellow), and a break of support favours a 2-day down pattern, which I would look for a move towards the blue channel 5-day filter"


Premium Report

us1-7z

S&P Weekly and 5-day pattern

Wednesday's trading followed Tuesday's reversal pattern down from the January 50% level....


Breaking support (Yellow) and moving directly down into the Weekly 50% level, which was matched by the 5-day channel blue filter.


  • Daily Trading Set-ups & Analysis

  • Index Futures SPI, DOW S&P, & Forex

  • Subscribe to the Trader Premium

  • http://www.datafeeds.com.au/premiumtrader.html


  • SPI Daily 7th January 09 recap

    "This week on the SPI has seen the market come down test the Weekly 50% level and bounce.

    Tuesday's bounce precisely of the lower support zones of 3679.


    And this now sets up further gains this week towards the Weekly highs.


    Once again use the levels with the 5-day pattern for day traders :- Support 3756"


    Premium Report


    SPI Weekly and 5-day pattern

    SPI supported above 3756, but any extension upwards failed to take hold, instead consolidating in 44-point rotations.

    Bias remains to continue towards the Weekly highs...


    S&P Daily 6th January 2009 recap

    "We can see there is a 3-week high breakout in the S&P, therefore there is an expectation of higher prices....

    Monday stalled and moved into a consolidating trading pattern, and we can see that in both markets that there was a breakout of Friday's highs.

    Whilst above those Friday highs there is now an expectation that the bias is to continue higher on Tuesday:- random length using support (Yellow)
    "

    Premium Report


    S&P Weekly and 5-day pattern

    Tuesday ended up trading between support and the January 50% levels.

    At this stage the bias continues to be UP, but it's struggling to close above the January 50% levels.


    • Daily Trading Set-ups & Analysis
  • Index Futures SPI, DOW S&P, & Forex
  • Subscribe to the Trader Premium
  • http://www.datafeeds.com.au/premiumtrader.html


  • SPI Daily 6th January 2009 recap

    I mentioned in the Weekly report that my expectation is that price would remain range bound between the Weekly 50% level and Weekly highs.

    The important pattern is that price is still supported above it, and it has supported the market for the past few weeks.

    If the SPI is going to continue higher then price should remain above the blue channel lows @ 3679 & Weekly 50%


    Premium Report


    SPI Weekly & 5-day pattern

    SPI opens higher comes down and test support and then moves up towards the upper channels and stalls.

    It's now upto US markets to continue higher, but this price action on the SPI favours new highs this week, if US markets remain supported.


    S&P 500 5th January 2009 recap


    S&P Weekly and 5-day pattern

    Expectation US markets would move into a 2-day 'stall' pattern before any potential continuation upwards.

    Price is still trading above last week's weekly highs, but more importantly remains below the January 50% levels.


    • Daily Trading Set-ups & Analysis
  • Index Futures SPI, DOW S&P, & Forex
  • Subscribe to the Trader Premium
  • http://www.datafeeds.com.au/premiumtrader.html


  • SPI 5th January 2009 recap


    SPI Weekly and 5-day pattern

    As pointed out in the Weekly report, last week failed to move above the Monthly 50% levels.

    Today has rotated back down into the Weekly 50% level, which started once price was below 3762.

    This Weekly 50% level is a major trend guide for January on any higher moves...


    • Daily Trading Set-ups & Analysis
  • Index Futures SPI, DOW S&P, & Forex
  • Subscribe to the Trader Premium
  • http://www.datafeeds.com.au/premiumtrader.html


  • Index Futures, Forex Reports 3rd Jan 09

    Weekly Index & Forex Reports out now...

    Australian Index (SPI) Futures

    http://austindex.blogspot.com/


    DOW and S&P Index Futures


    http://usindexweekly.blogspot.com/

    EUR/USD, AUD/USD. GBP/USD

    http://www.forexspread.blogspot.com/

    Note: Weekly BHP and Banking Reports Update

    http://aussie-stocks.blogspot.com/


    There is also a new Article found in the Trader SET:- intra-day timing techniques for day-trading the SPI futures.


    • Daily Trading Set-ups & Analysis
  • Index Futures SPI, DOW S&P, & Forex
  • Subscribe to the Trader Premium
  • http://www.datafeeds.com.au/premiumtrader.html


  • S&P (e-mini) 2nd January 08 recap


    S&P Monthly and Weekly

    As pointed out the last Weekend's Weekly Report:- the higher low in January favours higher prices back towards the monthly 50% levels....

    And this was set up perfectly with Monday's HOOK bar over the Weekly 50% level:-

    Dilernia principle
    :- Daily HOOK bar favours higher prices into Friday's close.


    SPI 2nd January 2009 part 2

    "New Primary and Secondary cycles begin, but I won't confirm those levels until the end of today's trading & Sycom. (Weekly timeframe)

    Expectation that the market is heading back towards the January 50% level, and possibly towards the Quarterly 50% level.

    However it still needs to breakout of the 3-week highs and close above them, as these 3-week highs have been major resistance and could still be major resistance"


    Premium Report


    SPI Weekly and 5-day pattern

    A bit disappointing today on the SPI, as the 3-week highs continue to cap the market from rising higher.

    Once it couldn't remain above 3725, price was naturally rotating back down into the
    5-day 50% level and consolidating once again.

    There is a shift in the Weekly highs next week towards the January 50% levels.....

    And we will see how US markets trade on Friday and whether sycom ends up closing above the 3-week highs.


    • Daily Trading Set-ups & Analysis
  • Index Futures SPI, DOW S&P, & Forex
  • Subscribe to the Trader Premium
  • http://www.datafeeds.com.au/premiumtrader.html


  •