If below down side is 42 points into the Support levels (50% level)
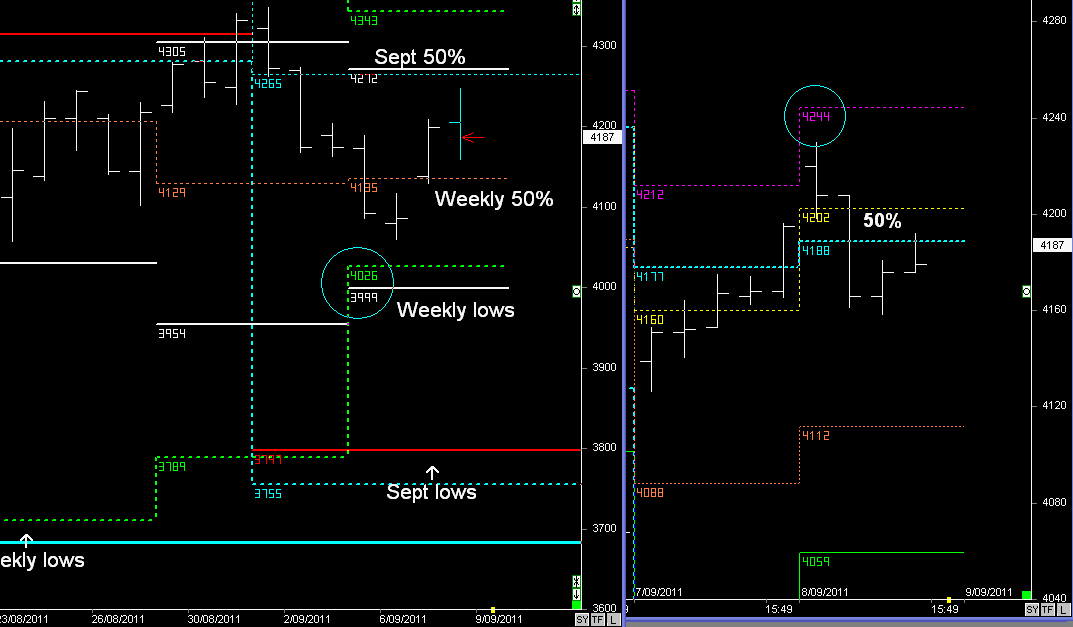
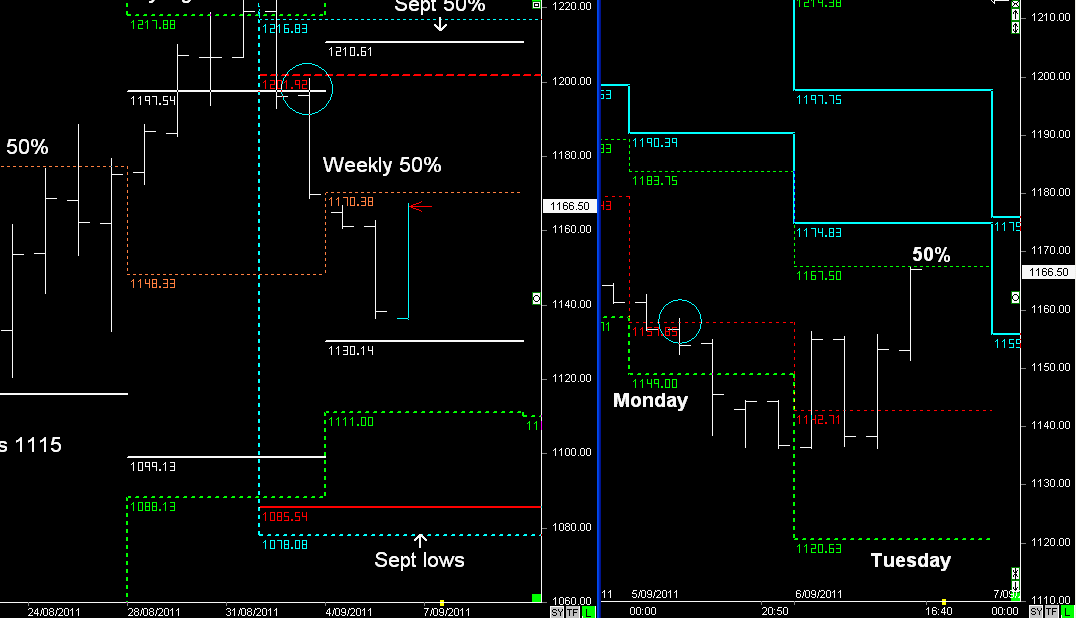
SPI Weekly and Daily range
SPI didn't hit resistance @ 4243-47, and support levels didn't hold within the daily range.
Market continued down the Primary range of 84 points from sycom highs and then moved into a consolidation pattern below the 50% levels. for the rest of today.
- Daily Trading Set-ups & Analysis
- Index Futures SPI, DOW S&P, & Forex
- Subscribe to the Trader Premium
- http://www.datafeeds.com.au/premiumtrader.html