SPI Report 4th December part 2


10:08am

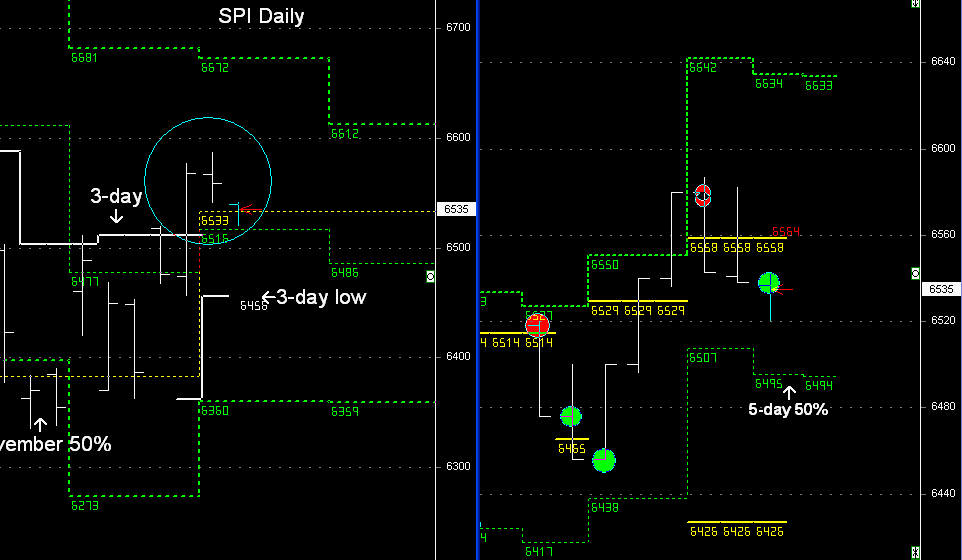
Market is following the 2nd day stall-reversal on Tuesday. (choppy-random day)

6538 was an ideal risk level today, because a bullish set-up would have moved upwards from 6538 and headed higher into an R44 spiral top.

The early price action of 22 point moves around these levels (trading above higher timeframe support zones) and today looks like a choppy trading day that needs to settle before trading again.

(long 6538-40 stopped 6533)

Won't trade trade longs whilst it's below 6538, and I won't be trading short positions at this stage either because of higher timeframe support levels.

SPI Report 4th December 2007


Above the 3-day highs, above the Weekly 50% level, above the December 50% level:- Short term and long term levels verify the UP trend.

Weekly expectation:- 2-day stalling period before the trend resumes.

Yesterday was the first day stalling day above the support levels, and today is the 2nd day.

Risk 6538

Tuesday:- another stalling day similar to yesterday and support is 6538 with the expectation that any up move would be 44 points.

Below Risk level and market is moving in a down trend towards the 3-day cycle lows or another 44 points.

If it does move down today it will be hard for me to short the market, or I probably won't short the market because I need a higher spiral point to trade down from to minimise RISK.

Therefore any movement down today, I’ll let the market run it’s course and trade again tomorrow.

No major set-ups for today.

US Index Report 3rd Dec part 2


Higher Weekly open and expectation that there will be a 2-day stall reversal.....


Monday is currently pushing down towards the 3-day lows and Weekly 50% level. I would like 1 more down day on Tuesday and hopefully it has a bit more length than today.

For the market to unwind and move much lower, then there has to be a lower close below the short-term support zones. (Weekly 50% level)

However:- I would look for 1 up day after any break of support, and then for the continuation of the Weekly down trend the following day. (sell next day higher open)

If this is going to follow my overall scenario of price moving back down into December lows, then there would probably be an unwinding of markets over the next 2 days before the 3rd day sends the market down (Thursday).

Market Dynamics is different in this month compared to November, and the longer it consolidates above the Weekly 50% level, and closer it comes to contract expiry the more chance it will move higher:-
March contract is running 100 points at a premium to the current SPOT.

FOREX REPORT 3rd December GBP/USD

~~~~~~~~~~~~~~~~~~~~~~~~~~~~~~~~~~~~

At this stage, the lower Weekly open, along with a major support level (December 50% level) has a much greater chance of finding support and then continuing higher with the over all trend towards December highs. (30th November)


Friday's report highlighted a couple of important variables:- lower weekly open and the December 50% level. (Support)

At this stage my view is for the price to head back towards the 3-day highs @ 2.0793, close above, but then rotate down and consolidate for 2-days, before the next trend can develop in the following week.

This week’s December 50% level support has to be confirmed with the close above the 3-day highs.

This up move began from a 90 pip spiral low, so the best trading set-ups for this week would be to trade longs using 90 pip spiral bottoms until the market closes above those 3-day highs...

US Index Report 3rd December 2007

~~~~~~~~~~~~~~~~~~~~~~~~~~~~~~~~~~
Please Read the Weekly US Index Report before proceeding with the Daily report.


Major resistance with a high probability that whilst price is trading below December 50% levels, the market will make a lower low. However this needs to be verified by the break of the Weekly 50% level and 3-day cycles, which might take a few days to unwind.

Short-Term:- higher Weekly open and expectation that there will be a 2-day stall reversal with the Weekly 50% levels a guide of the strength of the trend. (Weekly Report 1st December)


DOW and ES-minis

US markets are hitting major resistance and expectation that they will come under pressure once again.

Even though I have a modelling pattern of both markets re-testing November lows, the confirming price action needs to close below both the Weekly 50% level and the 3-day lows. This might take a couple of days to unwind.


Intra-day:- There is a cluster of support in both markets.

Weekly 50% level matches the 3-day lows, matches the 5-day 50% level.

IF this support is valid, then the down day needs to confirm the support before the next day moves higher.

Resistance in both markets on Monday 13501 (DOW) and 1494 (ES minis)

No major set-up for Monday.

Below monthly 50% levels the trend is 'bearish'

Above the 3-day cycles and Weekly 50% level the short-term is bullish.

Conflicting price action:- therefore it needs price action to unwind for the next major set-up.

SPI Report 3rd Dec part 5

~~~~~~~~~~~~~~~~~~~~~~~~~~~~~

"R44 spiral bottom then this is the Risk level. A Rise upwards towards 6594 would match the R44 spiral bottom and the 3-month 50% level." (Premium Report 7am)


12:53pm

This morning's Premium Report was based on not knowing the early direction of the market and where today was going to open.

A 44 point low early today would have been a BUY trade with the expectation of price moving up 44 points and into 6594.

Today it opened higher and moved into the R44 spiral point and the 'Sell' zone @ 6580, moved down 44 points, and is now following the early morning analysis of heading upwards.

I wouldn't be looking to 'Sell' the market again today, I would let the market run it's course and see where it opens up tomorrow.

Overall Trend is up....

SPI Report 3rd Dec part 4


11:46

Exit double R22 @ 6545 and exit for today.

Part of a stalling 2-day period above the higher timeframe 50% levels

Random expectation for the rest of today.
No more trades today.

SPI Report 3rd Dec part 3


11:35am

Partial Exit 6566 (re-entry 6578)

Stops 6581)

Expectation of 44 point completion (next exit double R22 range) and exit for today.

SPI Report 3rd Dec part 2


10:40

Partial exit 6575 (6579 entry)

Move stops to above todays highs @ 6583....

If stopped out I will re-enter 'shorts' again using intraday techniques.

Trading Above Dilernia Pivots, so market can remain supported today and not reverse back down until Tuesday.

After 50 minutes of trading below 6580, and it has barely moved 10 points then I've partial covered and moved stops to $dollar breakeven, as price looks like it wants to move towards 6594.

I would have preferred a 22 point down move by now to align with the pivot @ 6558 to partial exit

SPI Report 3rd December 2007

~~~~~~~~~~~~~~~~~~~~~~~~~~~~~~~~~~~

Please Read the Weekly report on the Australian Index before proceeding with the Daily report


Market is trading above the Monthly 50% level, Weekly 50% level and 3-day BUY cycle. In a nutshell the Market is UP, trend remains intact, and we subscribe to the view that the market is heading higher this month.

However, in the short-term:- Higher Weekly open and expectation that the market will stall-reverse-consolidate for the next 2-days before any UP trend resumes.

Today:- Risk 6580

It is the spiral stop of R44 range from Friday, which needs to complete.

I would think that there would be some push down, hopefully around 44 points, but because price is above certain levels there might not be much weakness in the markets today.

There is no major set-up today:- other than trying to pick whether Monday will move down, or Monday is another UP day before the market rotates back down on Tuesday.


Premium Report to follow..